Every report on AveeCare renders inside a card on the Recent Reports canvas. The card shows the data three different ways depending on which builder produced it: a sortable Table, a Chart visualization, or a Template packet with summary tiles, a chart, and a detailed data table in one printable layout. Each card has Print, Download CSV, and Download PDF icon buttons in the top-right corner so you can hand the same numbers to anyone in the format they prefer.
Quick answer
Open Reports. The output type is set by the builder you pick on the right sidebar. Manual Report Builder outputs a sortable Table. AI Report Generator outputs a Table, Chart, or text summary depending on your prompt. Template Reports produce a multi-section PDF-style packet with summary tiles, a chart, and a detailed data table. After the card appears, use the icon row to Print, Download CSV, or Download PDF.
1. Pick a builder to set the output type
The builder you pick on the right sidebar decides the output.
Template Reports give you presets like Revenue Summary, Aging Report, EVV Compliance. Each preset renders as a multi-section packet with summary tiles, a chart, and a detailed table. Manual Report Builder lets you pick a data source (patients, caregivers, visits, alerts, users, incidents, activities), tick the fields you want, add filters, and renders a sortable table. AI Report Generator takes a plain-English prompt and picks the best output shape (table, chart, or text) for the question.Run the report. A card lands at the top of Recent Reports.
The card header shows the report name, a method tag (Template, Manual, AI, or EDI), and the output-type pill (Table, Chart, Text, or none for Template packets). To the right of those are the icon buttons that let you act on the output: Print, Download CSV, Download PDF, and Dismiss.
2. Read the output-type badge on the report card
The pill next to the report name tells you which view you got.
A blue Table pill means a sortable rows-and-columns view, with search, filters, column show or hide, density, and full-screen controls along the top. A purple Chart pill means a bar, line, pie, or doughnut visualization underneath the header. A green Text pill means an AI-written narrative summary instead of rows or bars. Template runs do not show this pill because the whole packet renders below the header.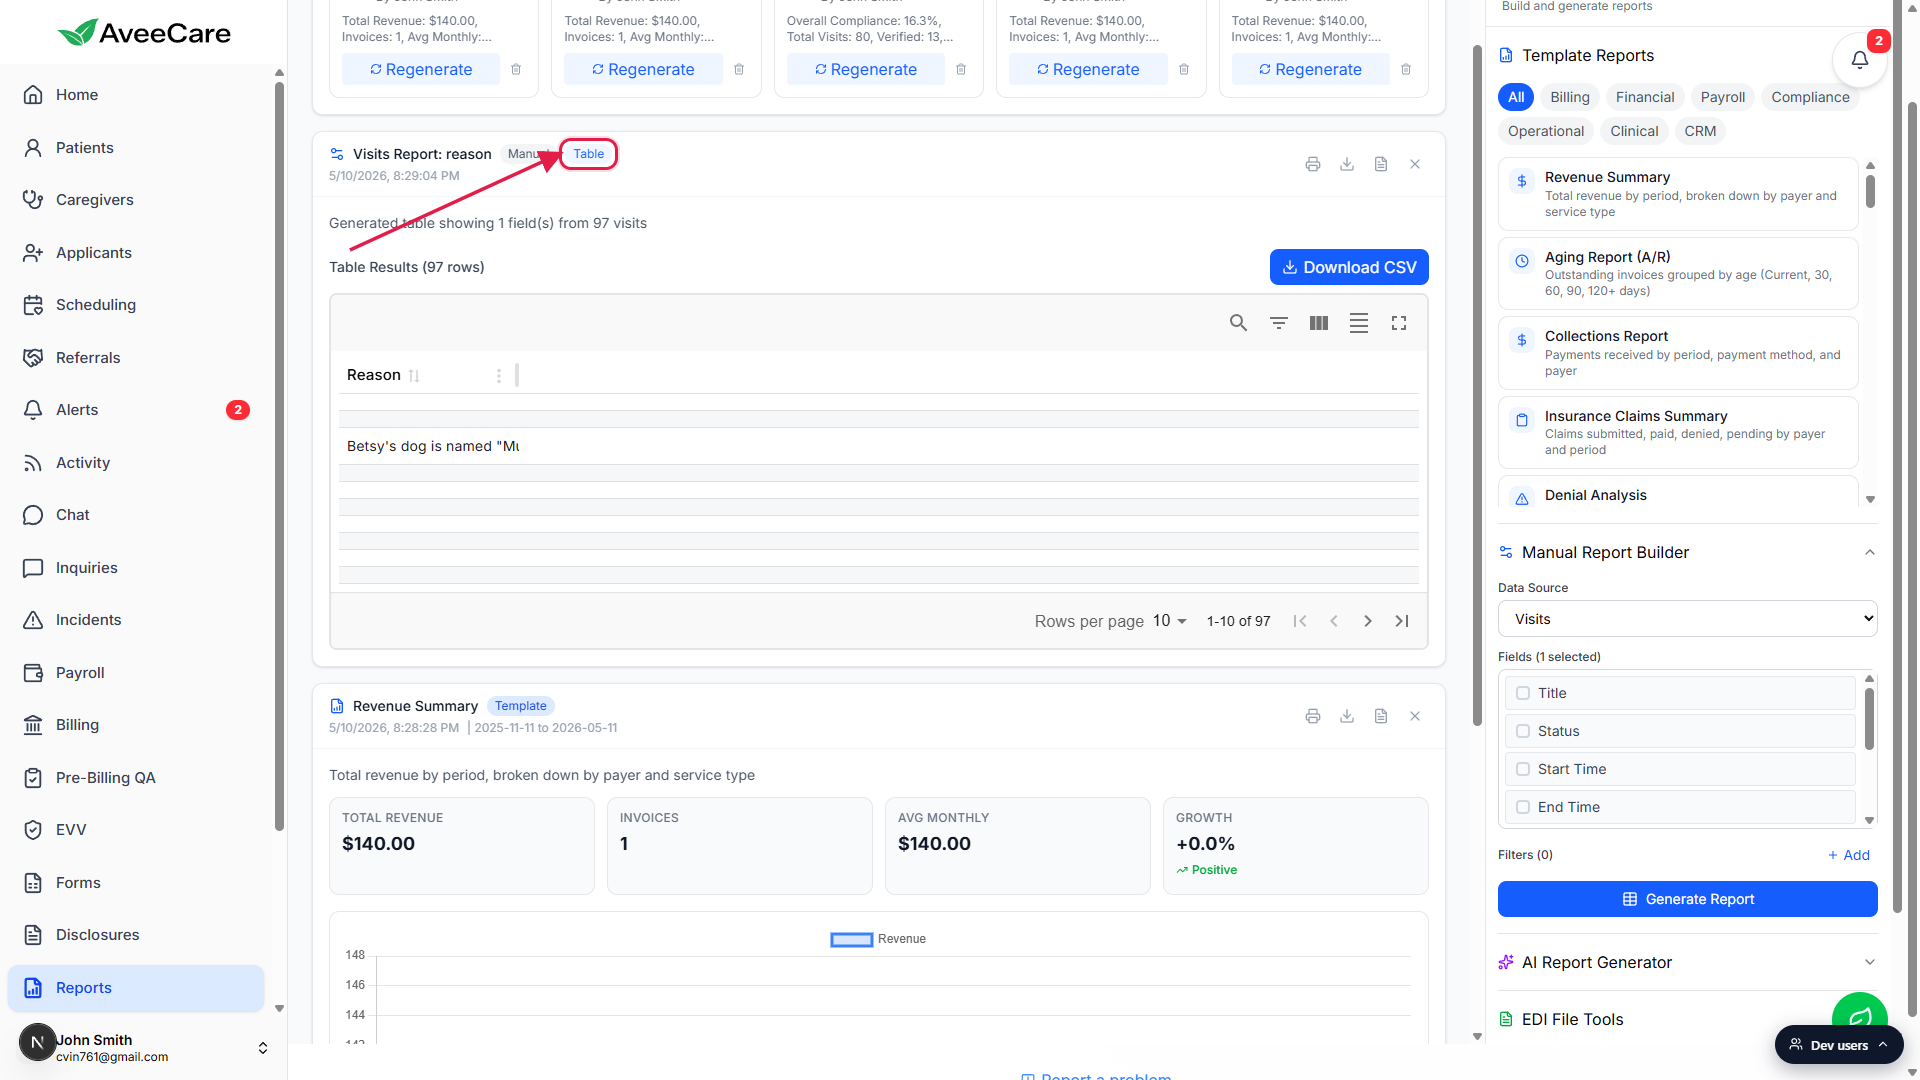
3. Use the chart and summary tiles on Template runs
Open a Template Report from the right sidebar.
Template Reports live in an accordion grouped by All, Billing, Financial, Payroll, Compliance, Operational, Clinical, and CRM. Pick something like Revenue Summary, click the preset, and AveeCare runs it against the date range from the Configuration panel below.The Template packet stacks summary tiles, a chart, and a detailed table.
Across the top you see big-number tiles for the headline KPIs (Total Revenue, Invoices, Avg Monthly, Growth on a Revenue Summary). Underneath is a Chart Visualization sized to the data (line for trends, bar for breakdowns, pie or doughnut for shares). At the bottom is a Detailed Data table with the same rows used to build the tiles and chart, complete with sort, filter, and column controls.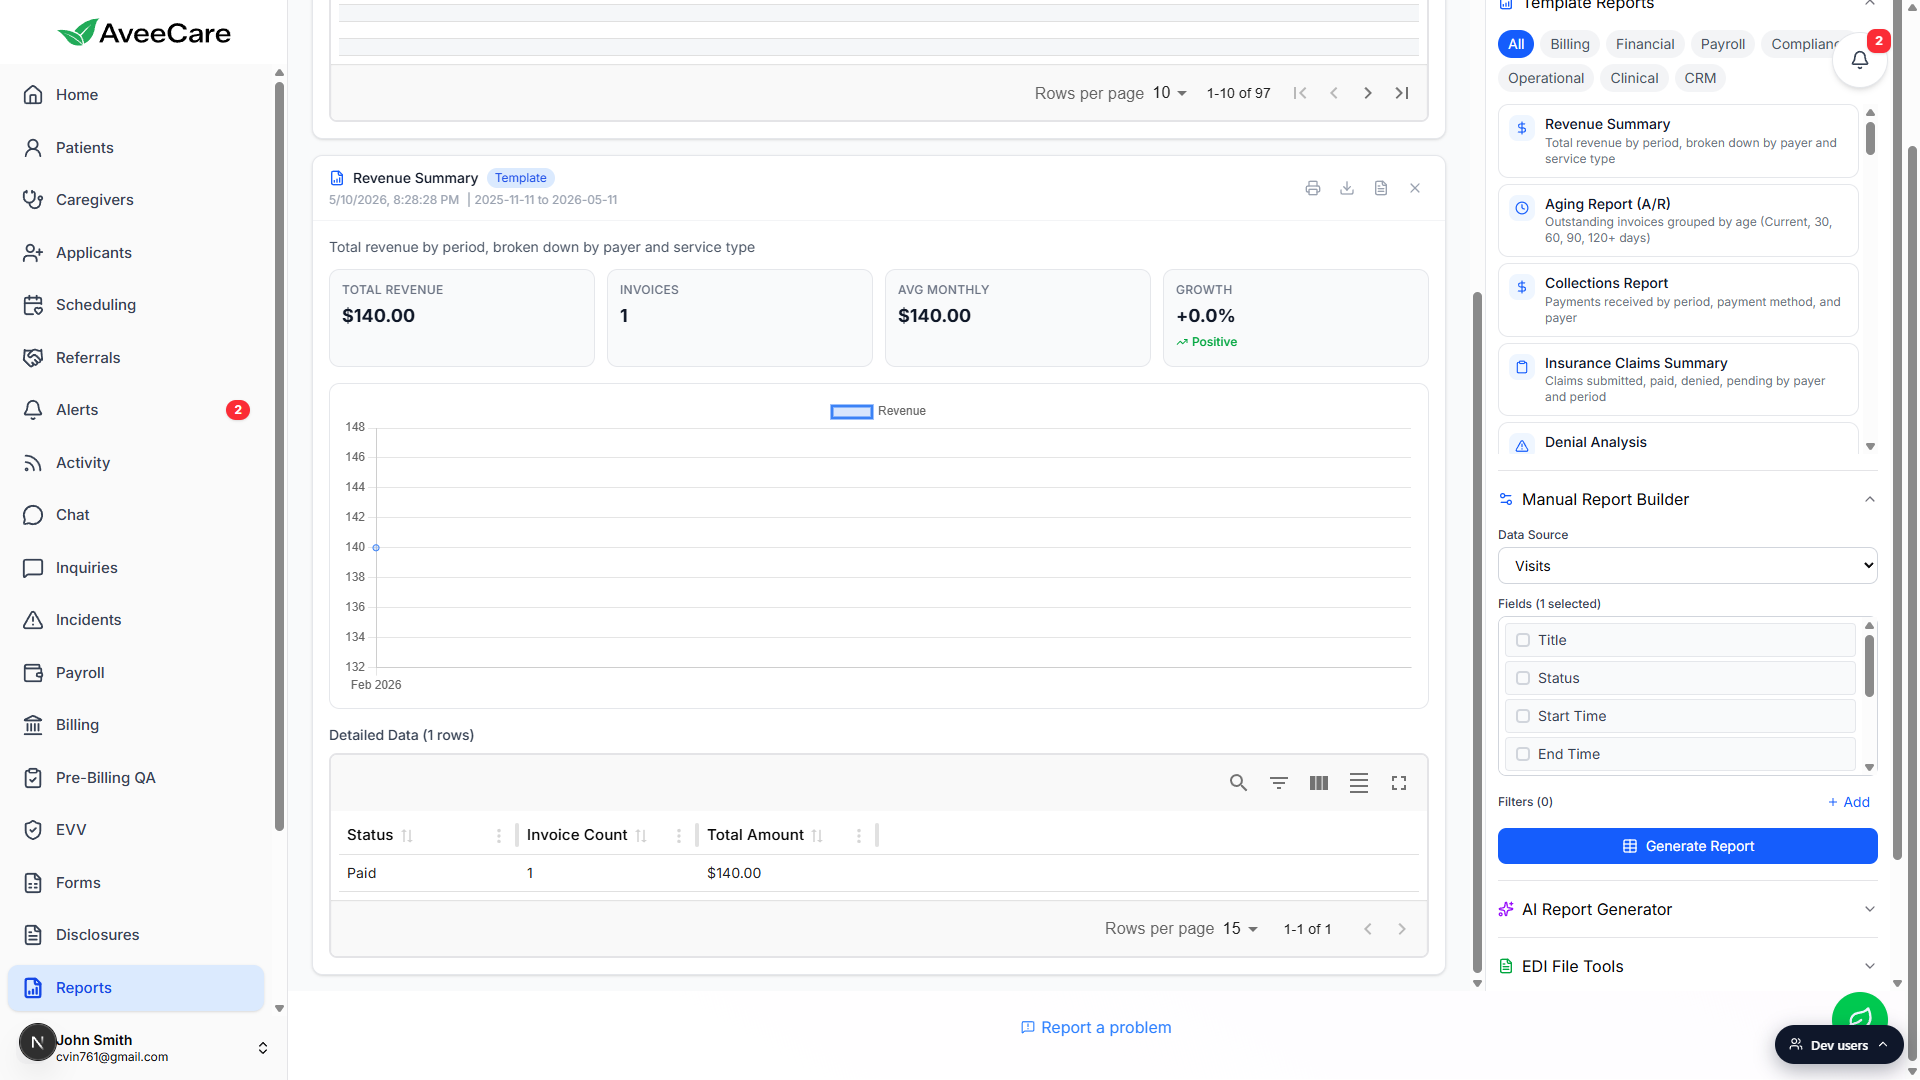
4. Download the table as CSV
Click Download CSV above the table to pull rows into a spreadsheet.
Manual and AI table runs put a blue Download CSV button above the table, in the same row as the Table Results count. Click it and the browser downloads a CSV named after the report ID or the template name. The CSV mirrors exactly what is rendered (same columns, same filtering) so the file opens cleanly in Excel or Google Sheets.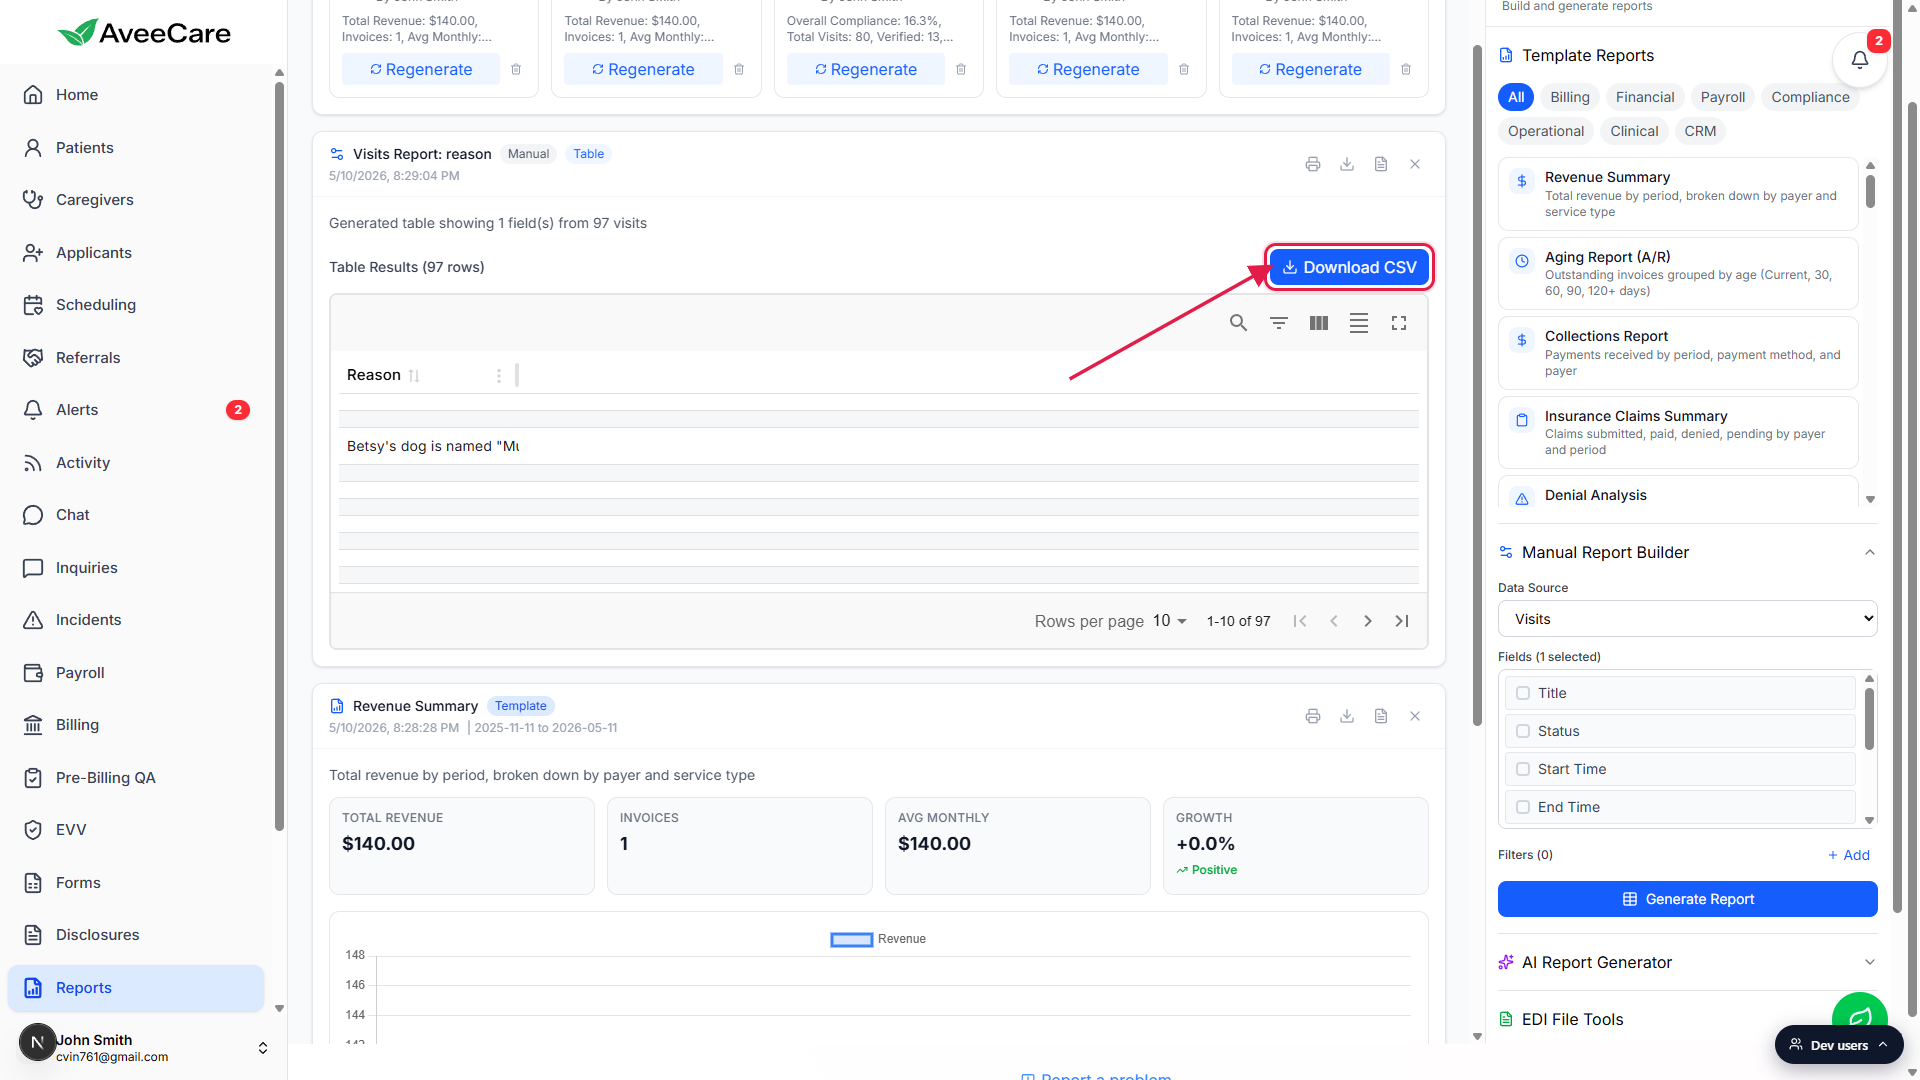
Use the Download CSV icon button on the card header for any output type.
The icon row also has a Download CSV button (the download arrow icon next to Print). It works on Template Reports too, turning the Detailed Data table into a CSV. If the report has no tabular data (a pure Chart or Text AI run), the CSV will be empty or the data array will be whatever the AI returned so it may not parse cleanly. Use Download PDF on those.
5. Download or print the PDF
Click Download PDF on the card header to save a formatted copy.
Download PDF is the document icon in the icon row, third from the right. Clicking it grabs everything in the report body (tiles, chart, and table on Template runs, or just the rendered output on AI and Manual runs), drops in an AveeCare header with the company name and date range, and downloads a PDF named after the template or the report ID.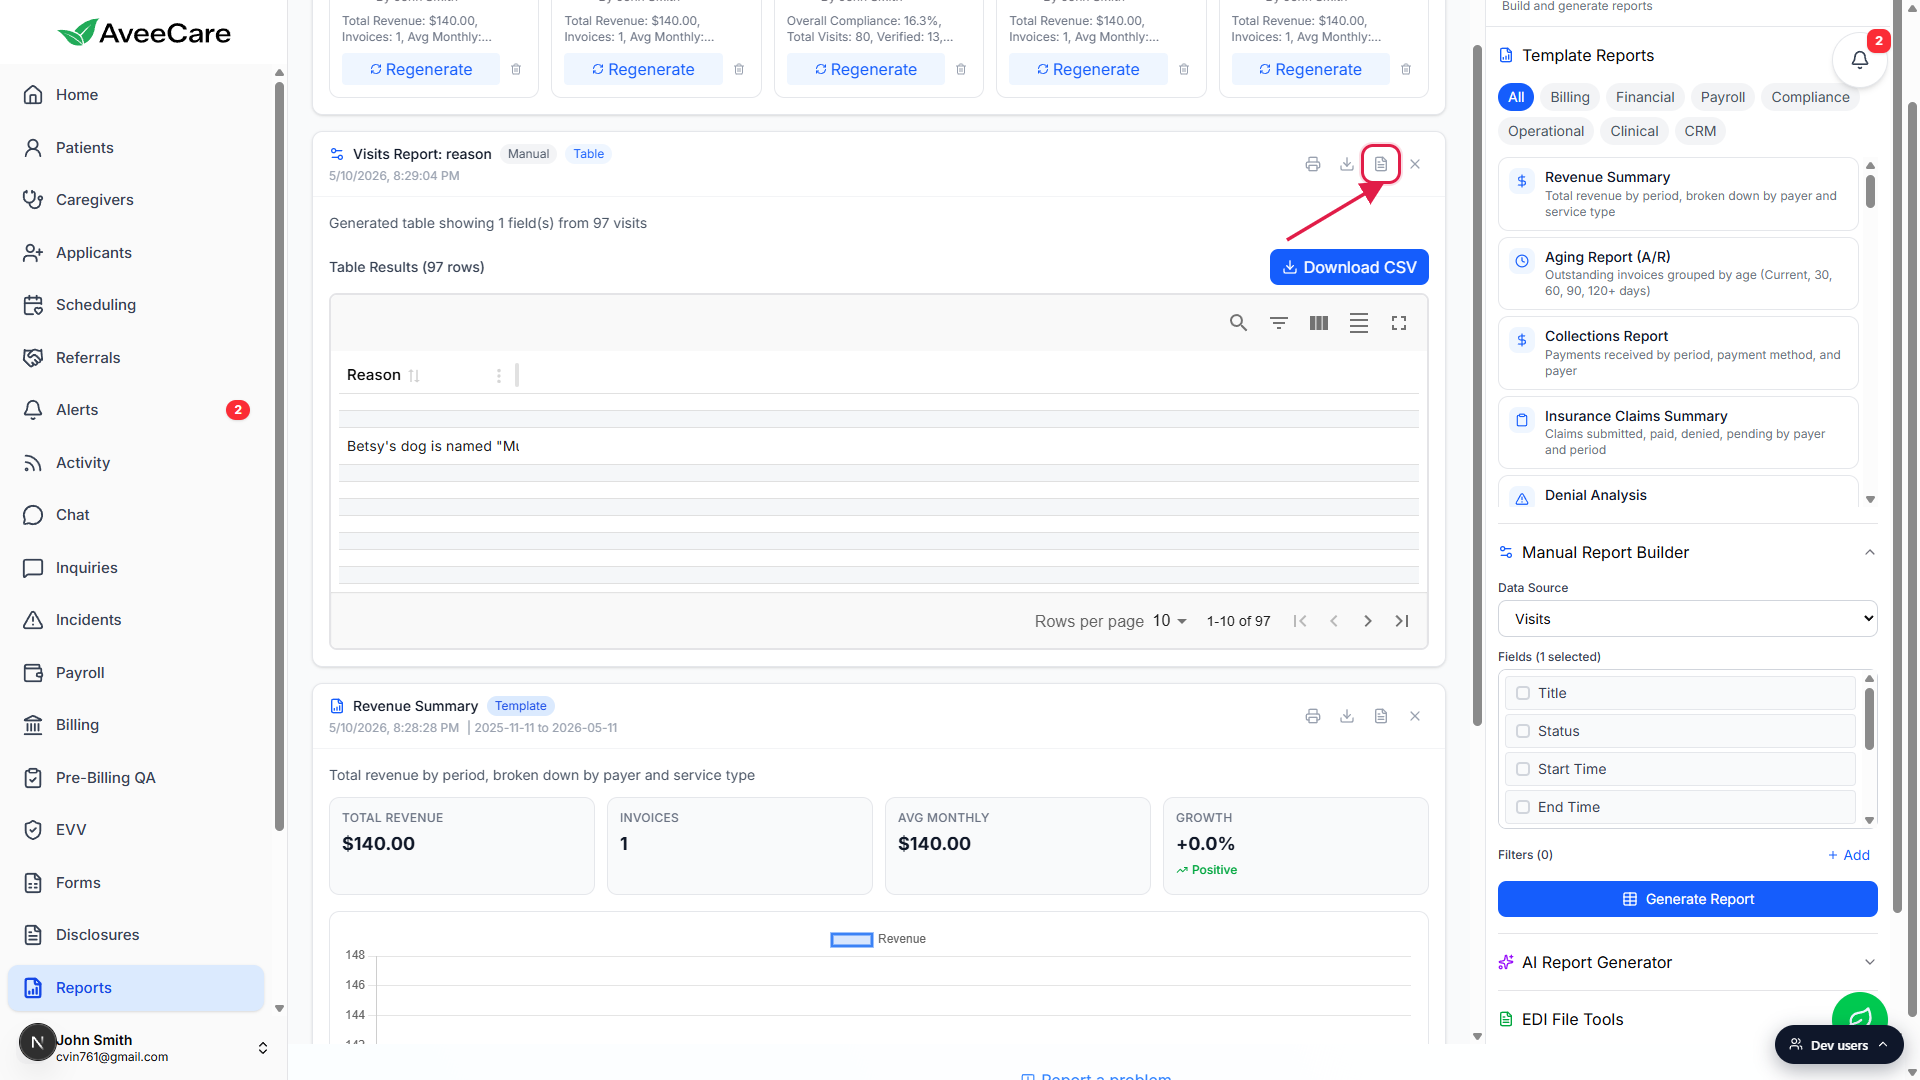
Click the Print icon (the printer) to send the same layout to a printer.
Print is the leftmost icon in the row. It opens the browser print dialog with the report body already laid out the way the PDF would render. Use Print when you want a physical copy or when you want to save as PDF through the system print sheet instead.
Common pitfalls
- Expecting a Table / Chart / PDF toggle on the report. There is no view switcher on a finished report card. The output type is fixed when the report is generated. To see the same data as a chart instead of a table, regenerate it with the AI prompt phrased as a chart (for example, “Show visit count by status as a bar chart”) or use a Template Report that renders the chart inline.
- Downloading CSV from a Chart or Text AI run. The CSV button still appears on every card, but a Chart or Text run has no tabular payload to export, so the file will be empty or will hold raw AI output. Pick Download PDF on those runs, or regenerate the report as a table.
- Forgetting to check the date range on Template Reports. Template Reports honor the Date Range in the Configuration panel on the right sidebar. If a packet looks empty, scroll the right sidebar to Configuration and confirm the dates cover the period you want before clicking the preset again.
- Treating PDF as a permanent record. The PDF is a snapshot of the rendered output at the moment you clicked the button. Regenerating the same report later may produce different numbers because the underlying data changes. Save the PDF if you need a fixed record, or schedule the report so a copy emails on your cadence.
- Closing the card before downloading. The Dismiss icon (the X on the right of the icon row) removes the rendered card from Recent Reports. The saved-report tile at the top of the page stays, so you can regenerate from there, but any unsaved download on the dismissed card is gone. Download or print before you click Dismiss.