The Manual Report Builder is the explicit, no-AI way to compose a report in AveeCare. You pick a data source (Patients, Caregivers, Visits, and so on), tick the fields you want as columns, optionally narrow the rows with filters, and click Generate Report. The result lands in the canvas as a sortable table and is saved to Recent Reports for next time.
Quick answer
Open Reports, click Manual Report Builder in the right rail to expand it. Pick a Data Source, tick the Fields you want, add Filters if you need them, then click Generate Report. The output table lands in the canvas with sortable columns and a Download CSV button.
Data sources you can pick
The Data Source dropdown has seven options:
- Patients. Demographics, contact info, allergies, and patient flags.
- Caregivers. Caregiver records, employment status, and credentials.
- Visits. Visit title, status, start and end time, recurring flag, location, and reason.
- Alerts. Triage alerts opened against patients or caregivers.
- Users. Tenant users with roles.
- Incident Reports. Incidents logged from the Incidents page.
- Activities. Activity log entries across the tenant.
Each source has its own field list. Switch sources at any time and the field grid and filter operators reset to match.
1. Open Reports and expand Manual Report Builder
Open Reports from the left sidebar.
Reports loads with Recent Reports across the top, an empty canvas in the middle, and the Report Tools rail on the right. Template Reports is expanded by default.In the right rail, click Manual Report Builder to expand the accordion.
Manual Report Builder sits below Template Reports and above AI Report Generator. The expanded panel shows Data Source, Fields, Filters, and a Generate Report button.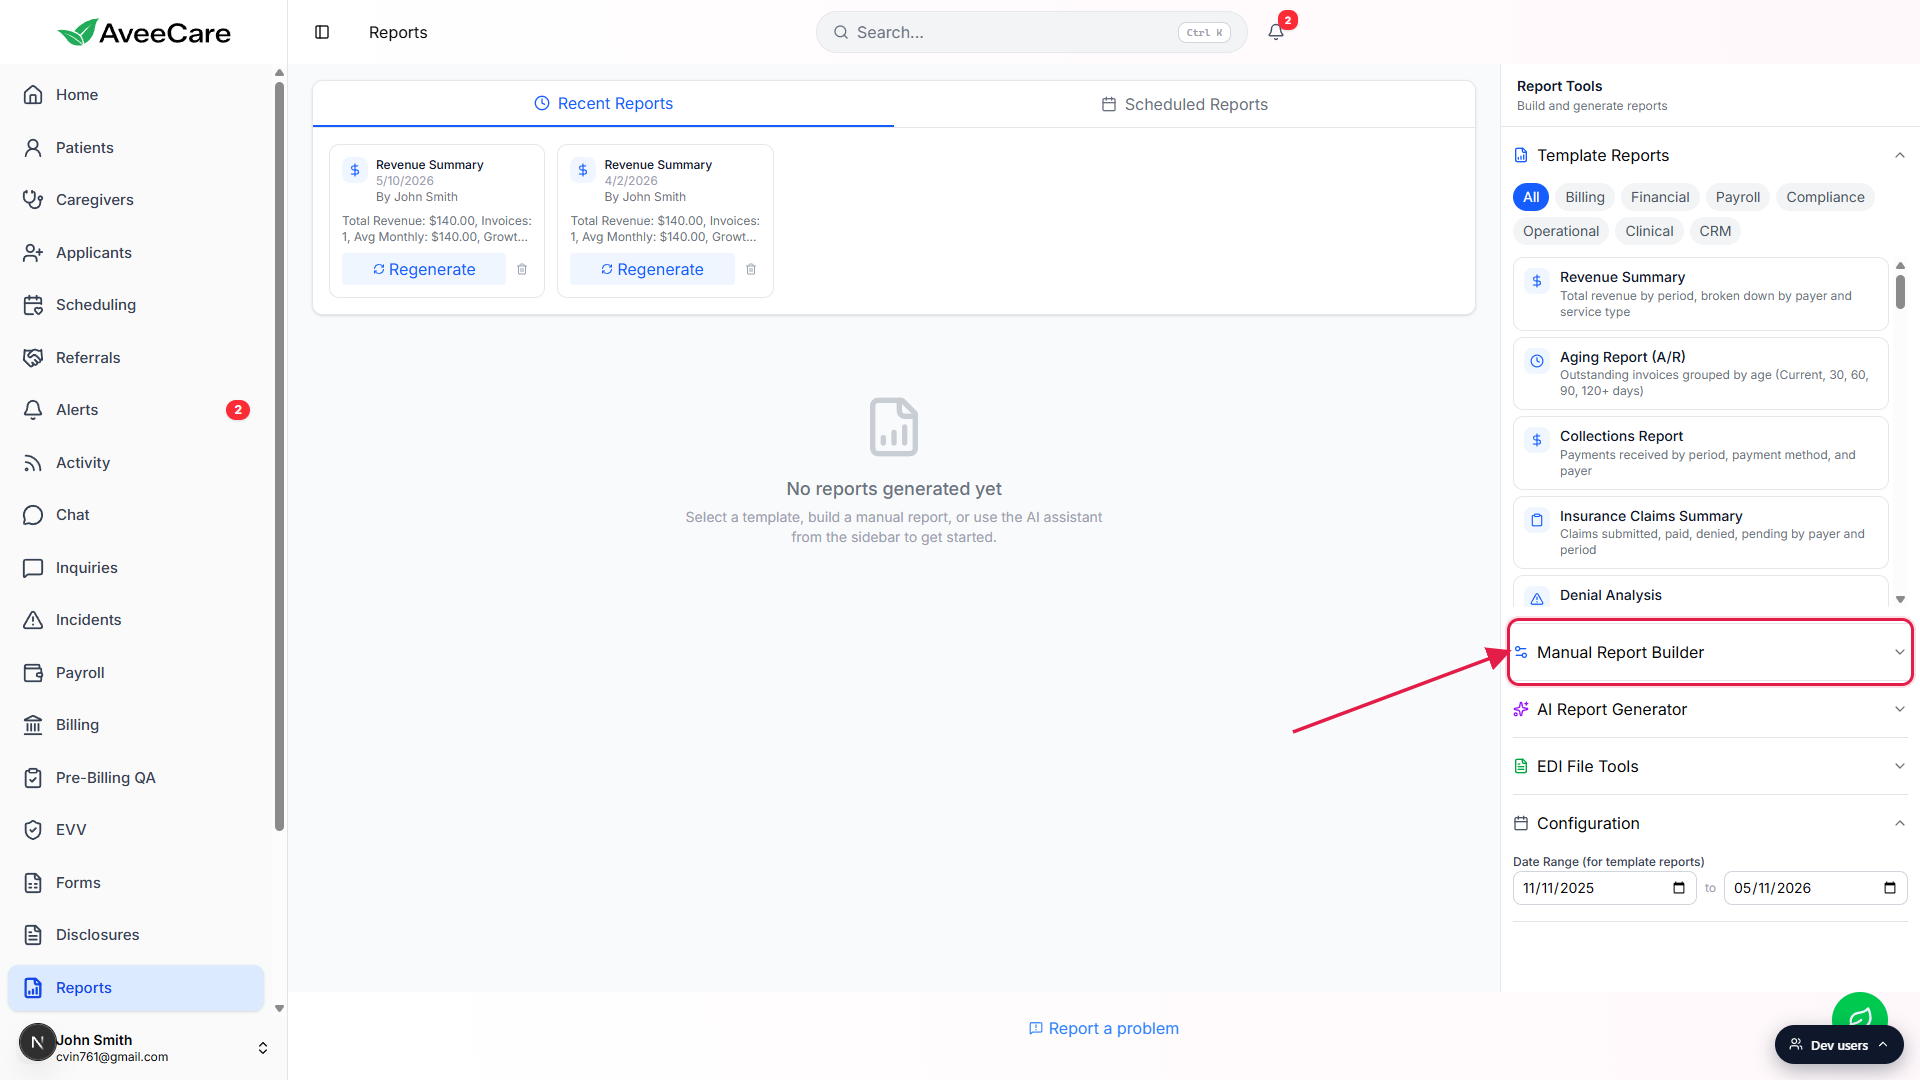
2. Pick a data source
Click the Data Source dropdown and pick what you want a report about.
The dropdown defaults to Patients. Switching to another source replaces the Fields grid with that source's field list and resets any filters. Pick the source closest to the entity you want one row per. Want one row per visit? Pick Visits. Want one row per caregiver? Pick Caregivers.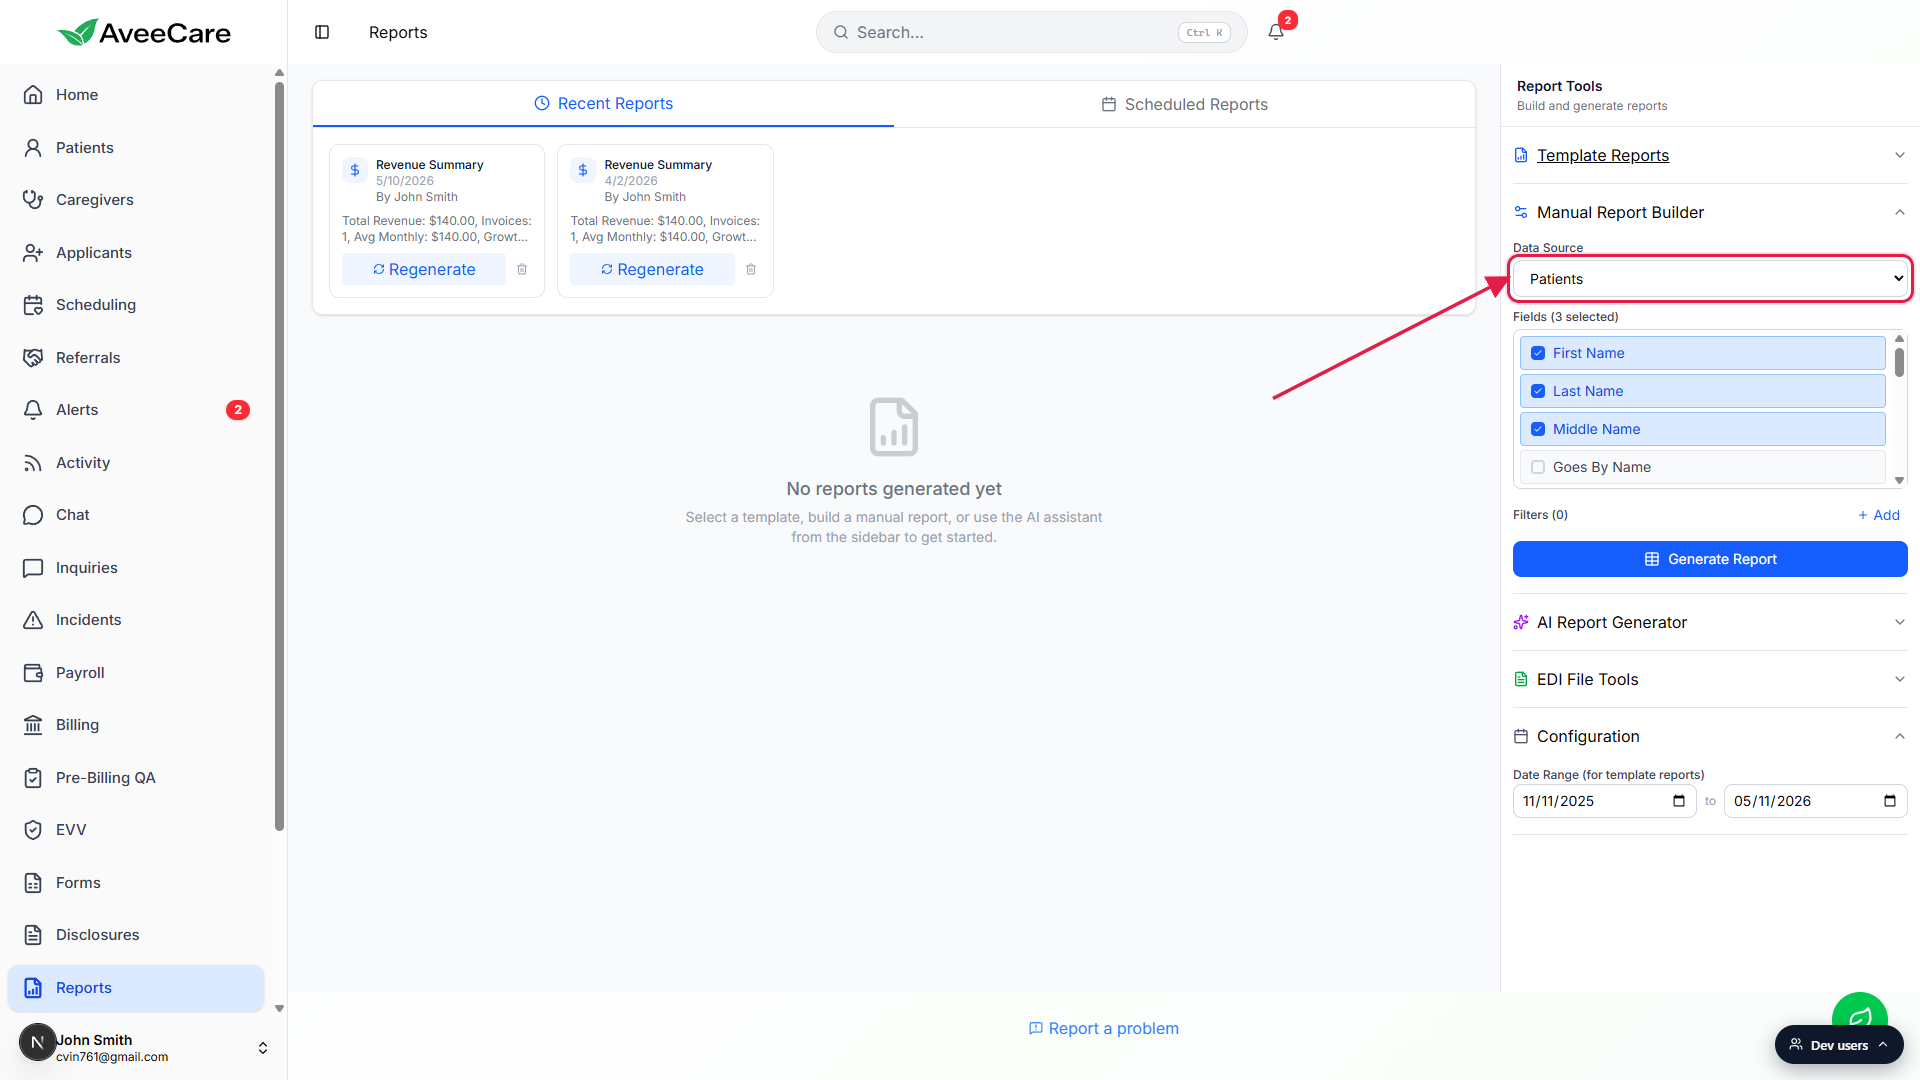
3. Tick the fields you want as columns
Click any field in the Fields list to toggle it on or off.
Each tick adds a column to the report output. The label above the list updates live, for example Fields (3 selected). You can pick as many fields as you like, but reports above roughly 50 columns start to render slowly on screen, so keep the column list lean.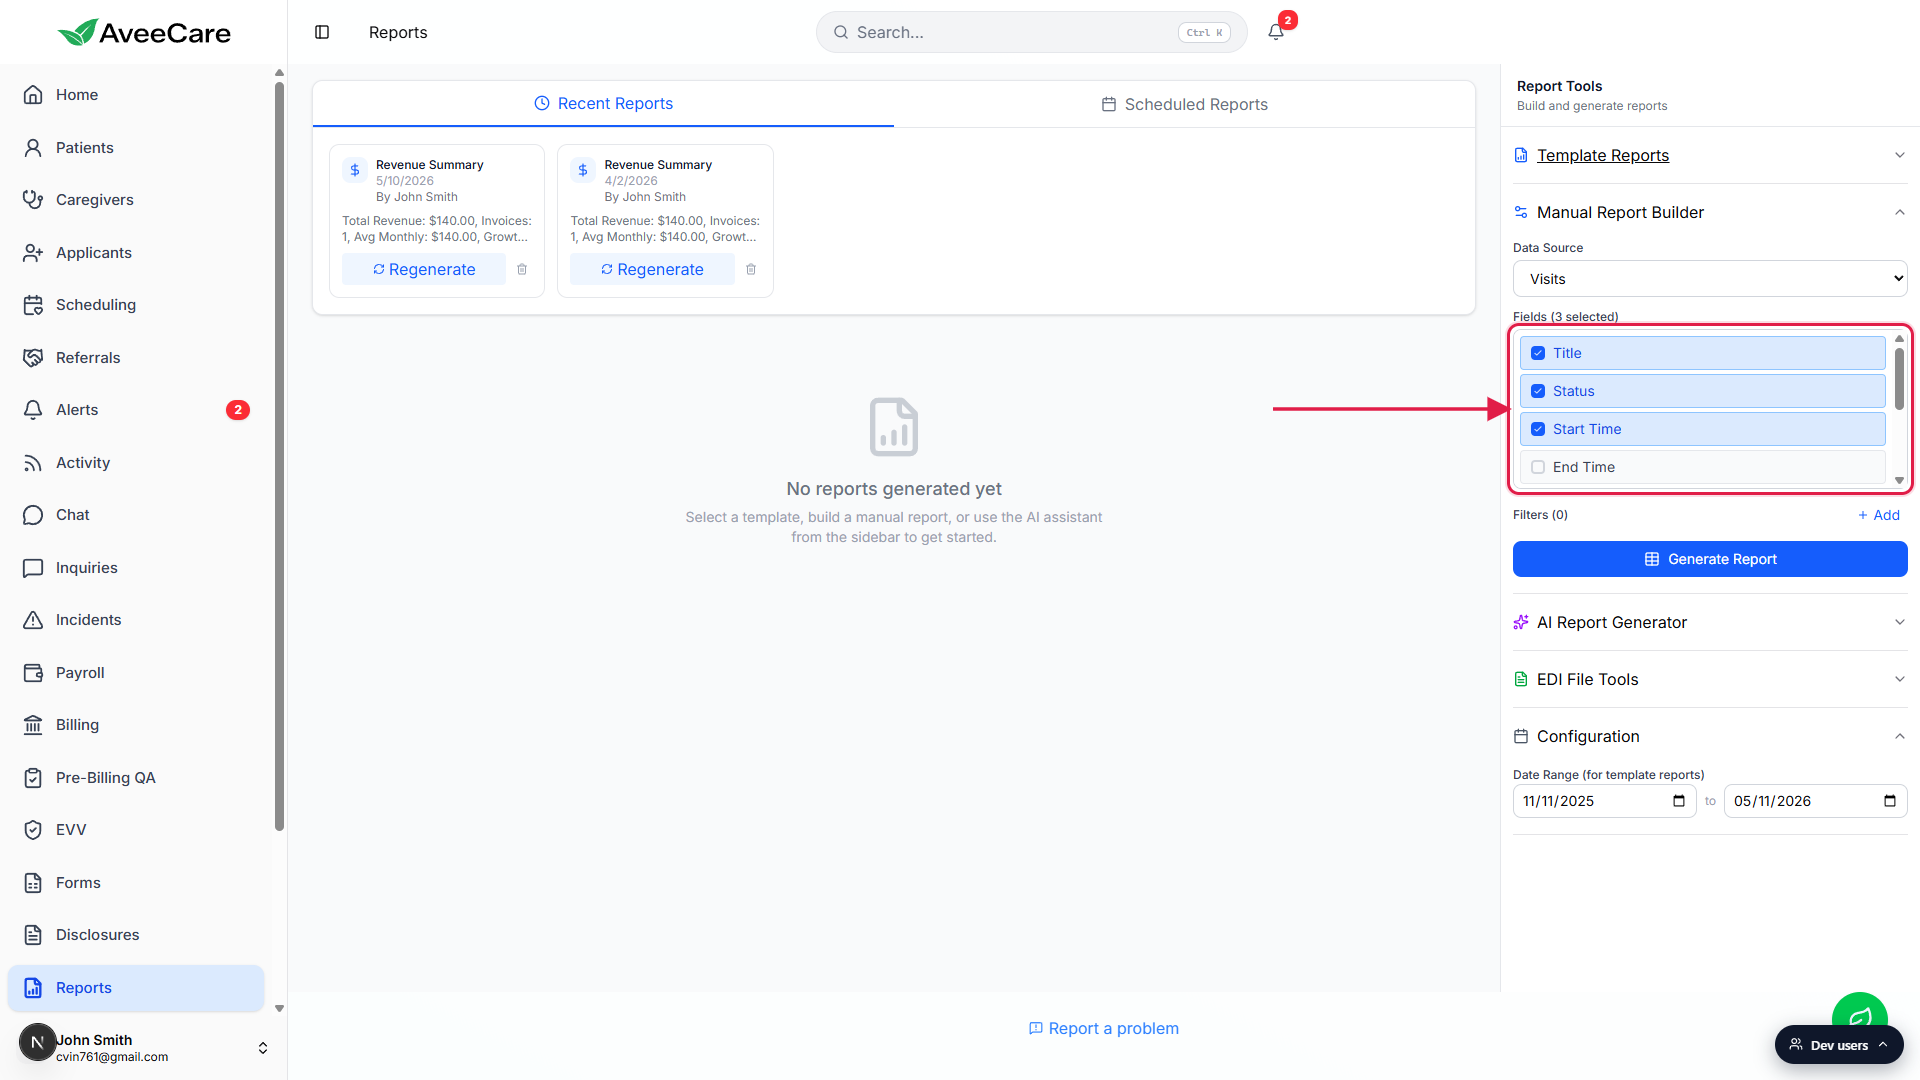
Scroll the Fields list for the rest of the available columns.
Each source has more fields than fit in the panel at once. Visits, for example, exposes Title, Status, Start Time, End Time, All Day Event, Location Address, Reason, and Recurring. Patients exposes First Name, Last Name, Middle Name, Goes By Name, and more.
4. Add filters to narrow the rows
Click +Add next to Filters to add a new filter row.
Each filter row has three controls: the field to filter on, the operator, and the value. The operators available change based on the field type. Text fields offer Equals and Contains. Number fields add greater-than and less-than. Dates add On Day, After, Before, and Between. Enum fields add In and Not In.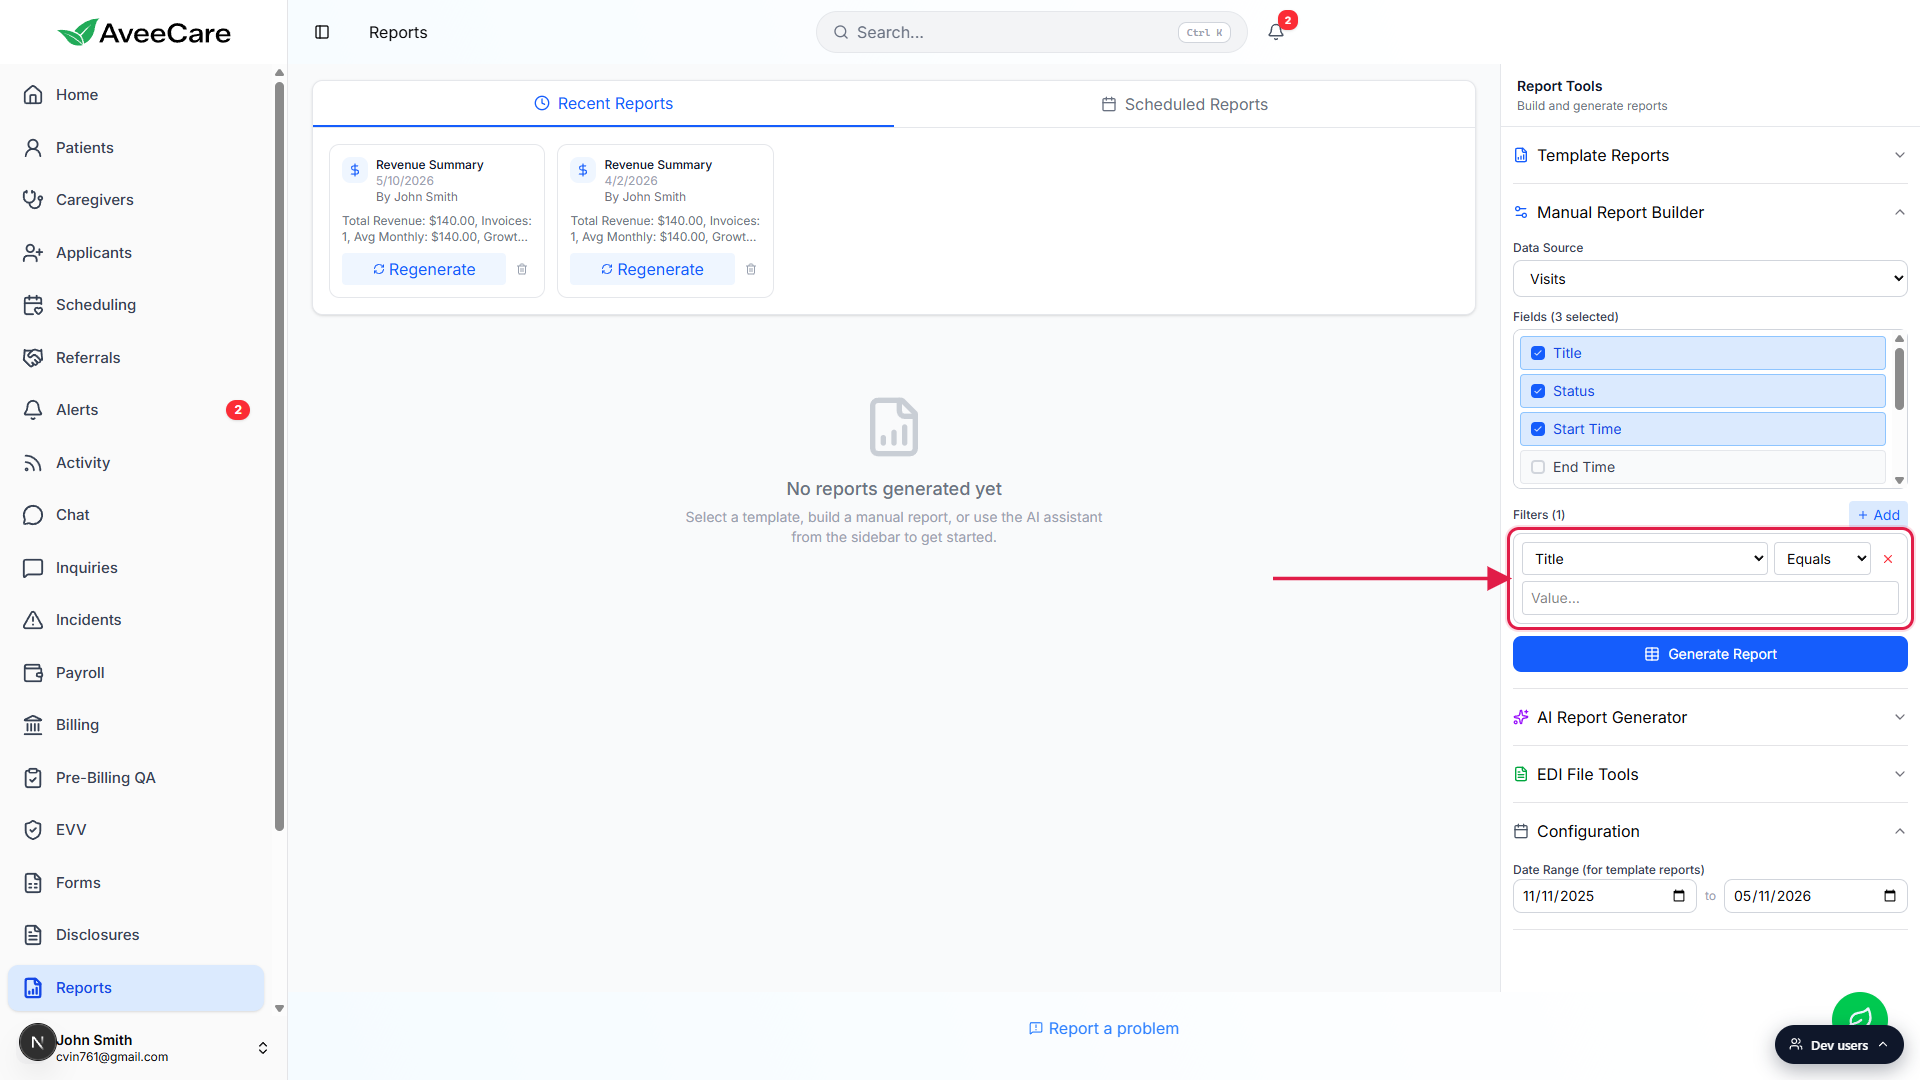
Add as many filters as you need. Click the red X to remove one.
Filters combine with AND. If you add Status equals Scheduled and Start Time after 2026-01-01, the result is visits that match both conditions. There is no OR connector in the manual builder.
5. Click Generate Report and review the table
Click Generate Report.
The button is disabled until you have at least one field ticked. When you click it, a spinner appears and the result drops into the canvas a moment later.Read the output: a header card with metadata and a sortable table below.
The header card shows the report title (for example, Visits Report: title, status, startTime), a Generated table showing N field(s) from N rows note, and a Download CSV button. The table below has sortable columns, a per-column menu, and pagination with a Rows per page selector.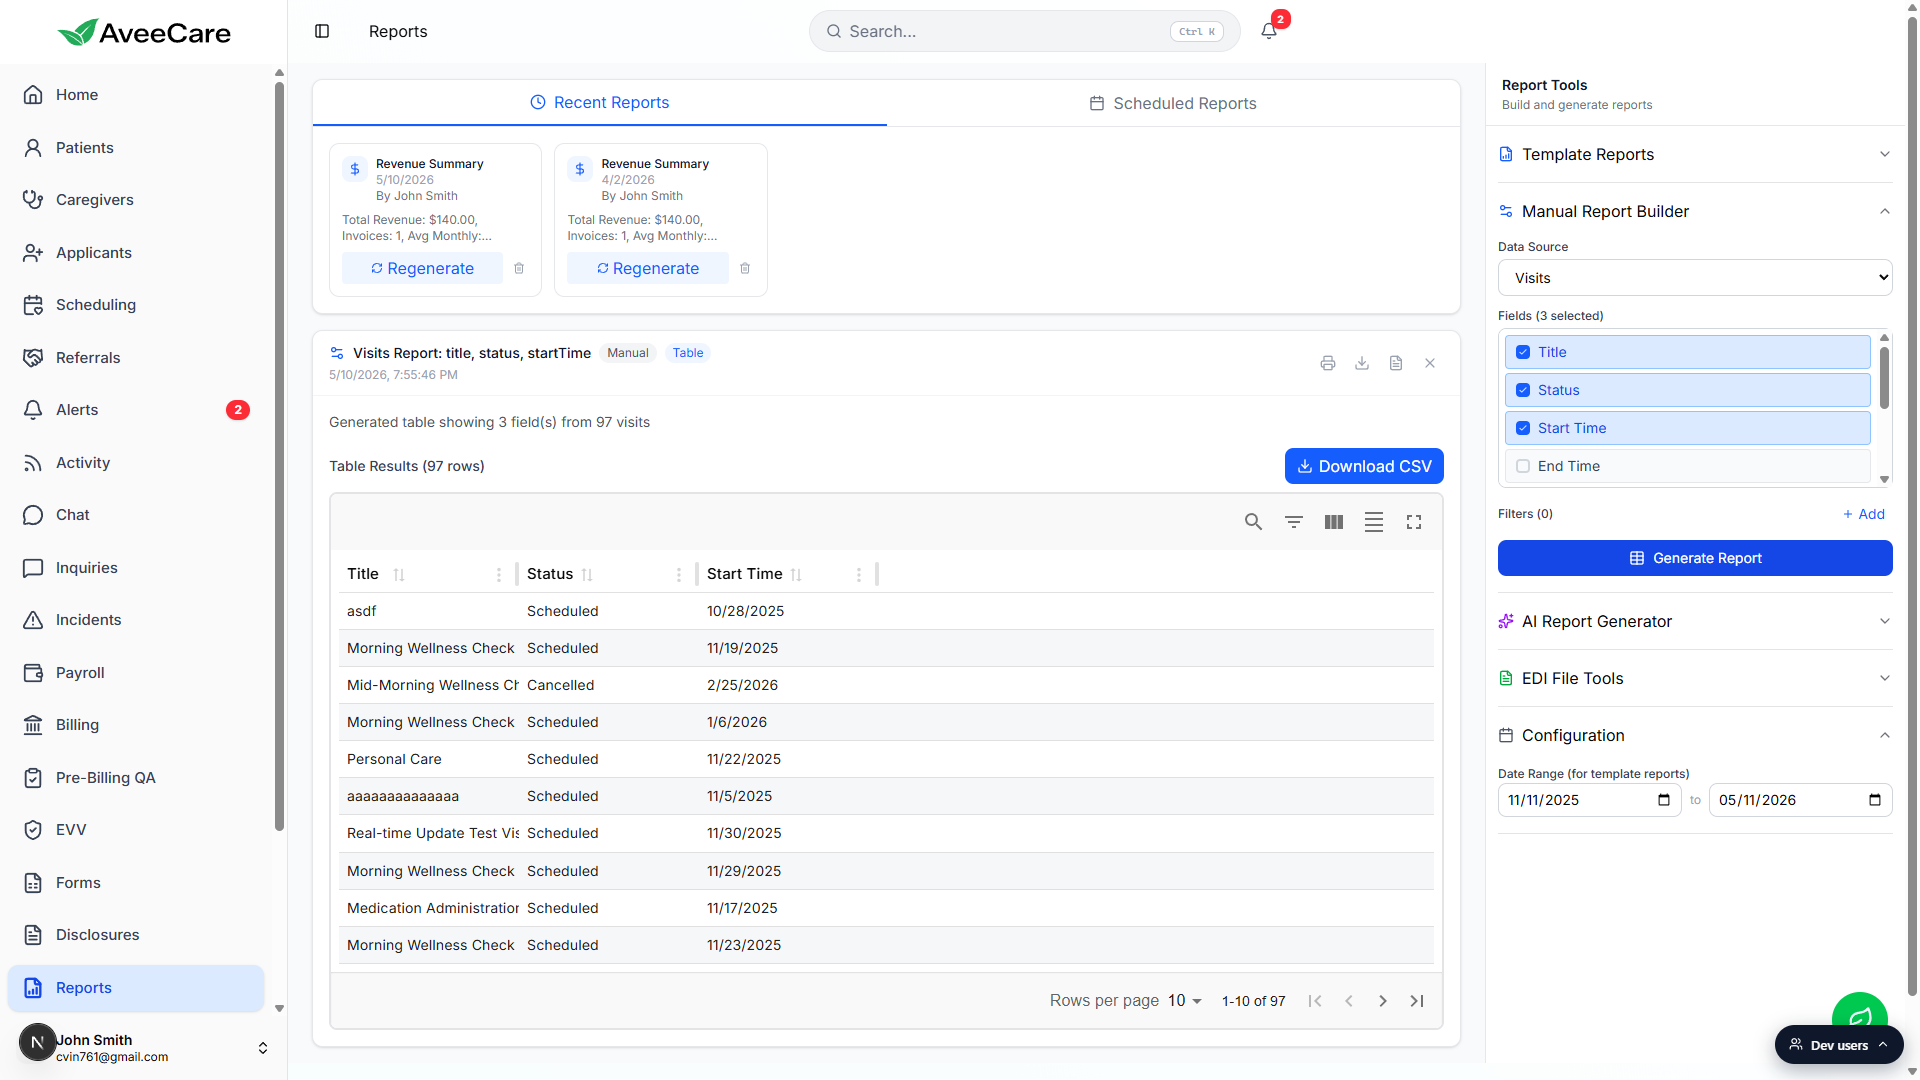
Use Download CSV, Print, or Dismiss from the report card.
The icon row in the top-right of the report card offers Print and Download CSV. Saved reports also land in Recent Reports across the top of the page so you can click back into them later.
Common pitfalls
- Generate Report button stays greyed out. You have not ticked any fields yet. The button activates the moment Fields shows at least one selected.
- Empty result after adding a filter. Filter values are exact-match by default. If you typed Title equals Morning, no rows will match (you want Title contains Morning instead). Use Contains for partial text matches.
- Cross-source joins are not in this builder. You pick one data source at a time. For combined views like Patients plus their Visits, use a Template Report (Patient Census, Visit Volume) or the AI Report Generator, which can plan the join for you.
- Too many columns slows the table. Above roughly 50 columns, scroll and sort start to feel sluggish. Strip the field list to what you actually need, or split into two reports.
- Filter operators change with field type. If you switch the field on an existing filter row, the operator dropdown changes too. A leftover value from the previous field may need to be re-entered.