AveeCare turns plain English into a report. You type what you want to see, like “all active patients with allergies” or “visits by caregiver this month,” and AveeCare picks the data, builds the table or chart, and drops the result into the canvas. The AI Report Generator lives in the right sidebar of the Reports page, alongside the Template Reports list and the Manual Report Builder.
Quick answer
Open Reports, click AI Report Generator in the right sidebar to expand it, type a prompt like Show all active patients with allergies, then click Generate AI Report. The result appears in the canvas and is kept in Recent Reports so you can return to it.
1. Open Reports and expand AI Report Generator
Open Reports from the left sidebar.
The Reports page opens with Recent Reports across the top, an empty canvas in the middle, and the Report Tools rail on the right.Scroll the right rail to AI Report Generator and click to expand it.
AI Report Generator sits below Manual Report Builder in the right-rail accordion. The expanded panel shows a privacy reminder about AI features and a prompt textarea.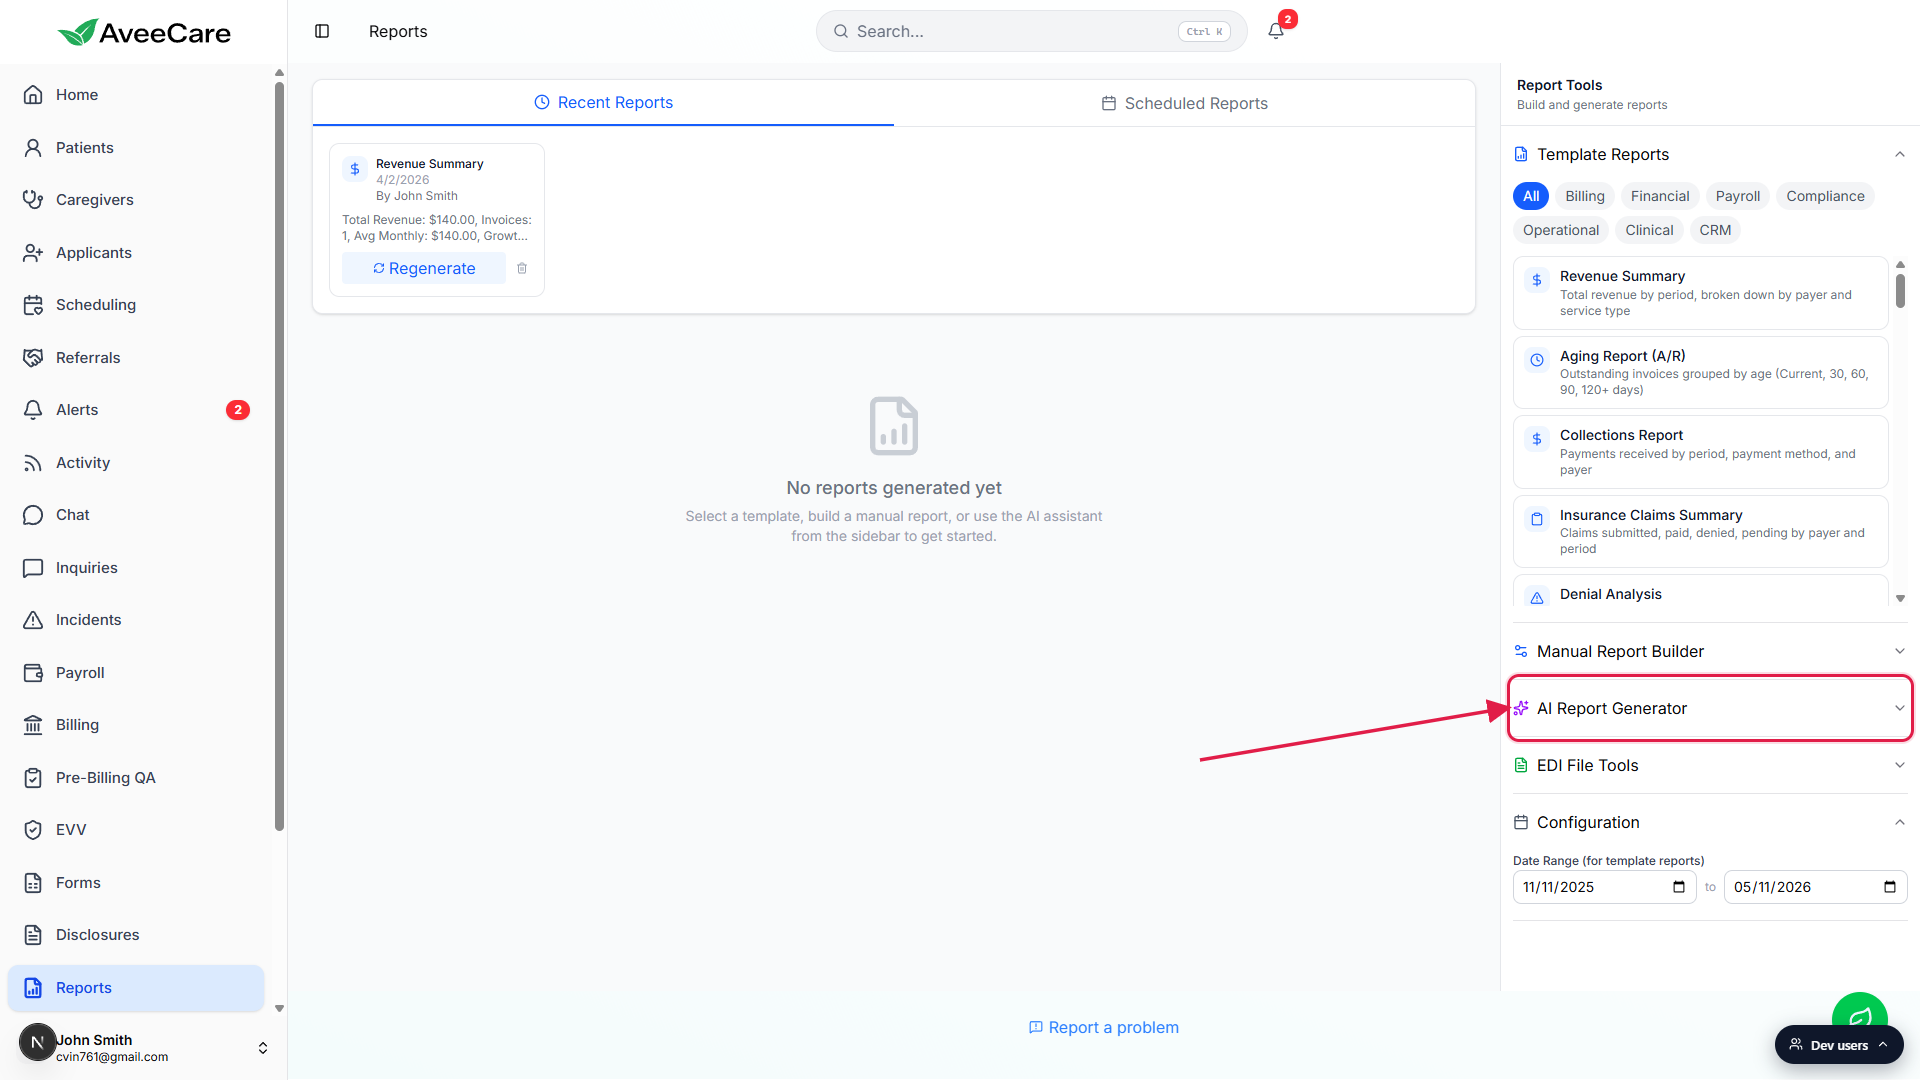
2. Type a plain-English prompt
Click the prompt textarea and describe what you want.
The placeholder shows two example prompts: Show all active patients with allergies and Create a pie chart of visit statuses. Be specific about the metric you want, the time range, and the dimension you want to slice by.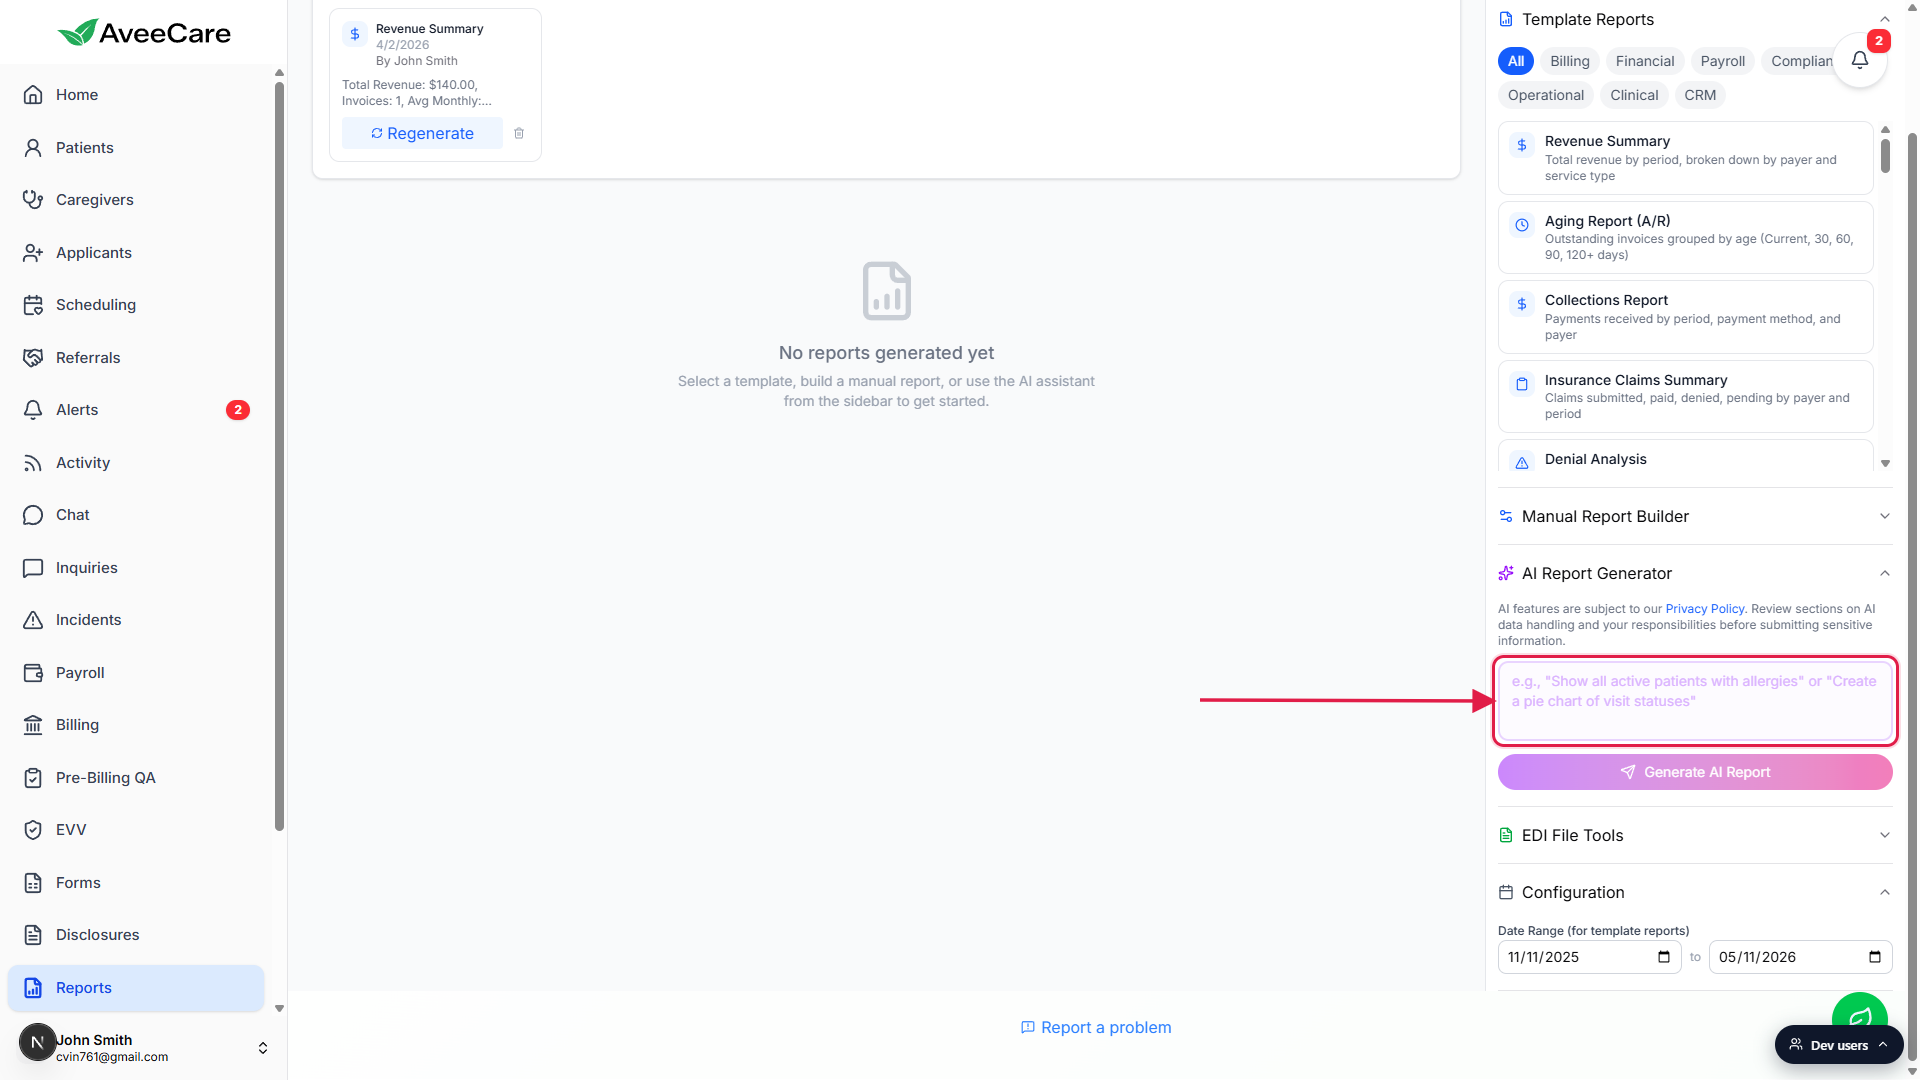
Skim the AI usage notice above the box.
AveeCare reminds you that AI features are governed by the Privacy Policy. Patient data stays on your tenant. The AI sees synthetic test data while it drafts the query, then the validated query runs against your real data locally.
3. Click Generate AI Report
Press the purple-to-pink Generate AI Report button.
The button becomes active as soon as the prompt has any text. While the report generates, the button shows a spinner and the canvas shows a Generating report... placeholder.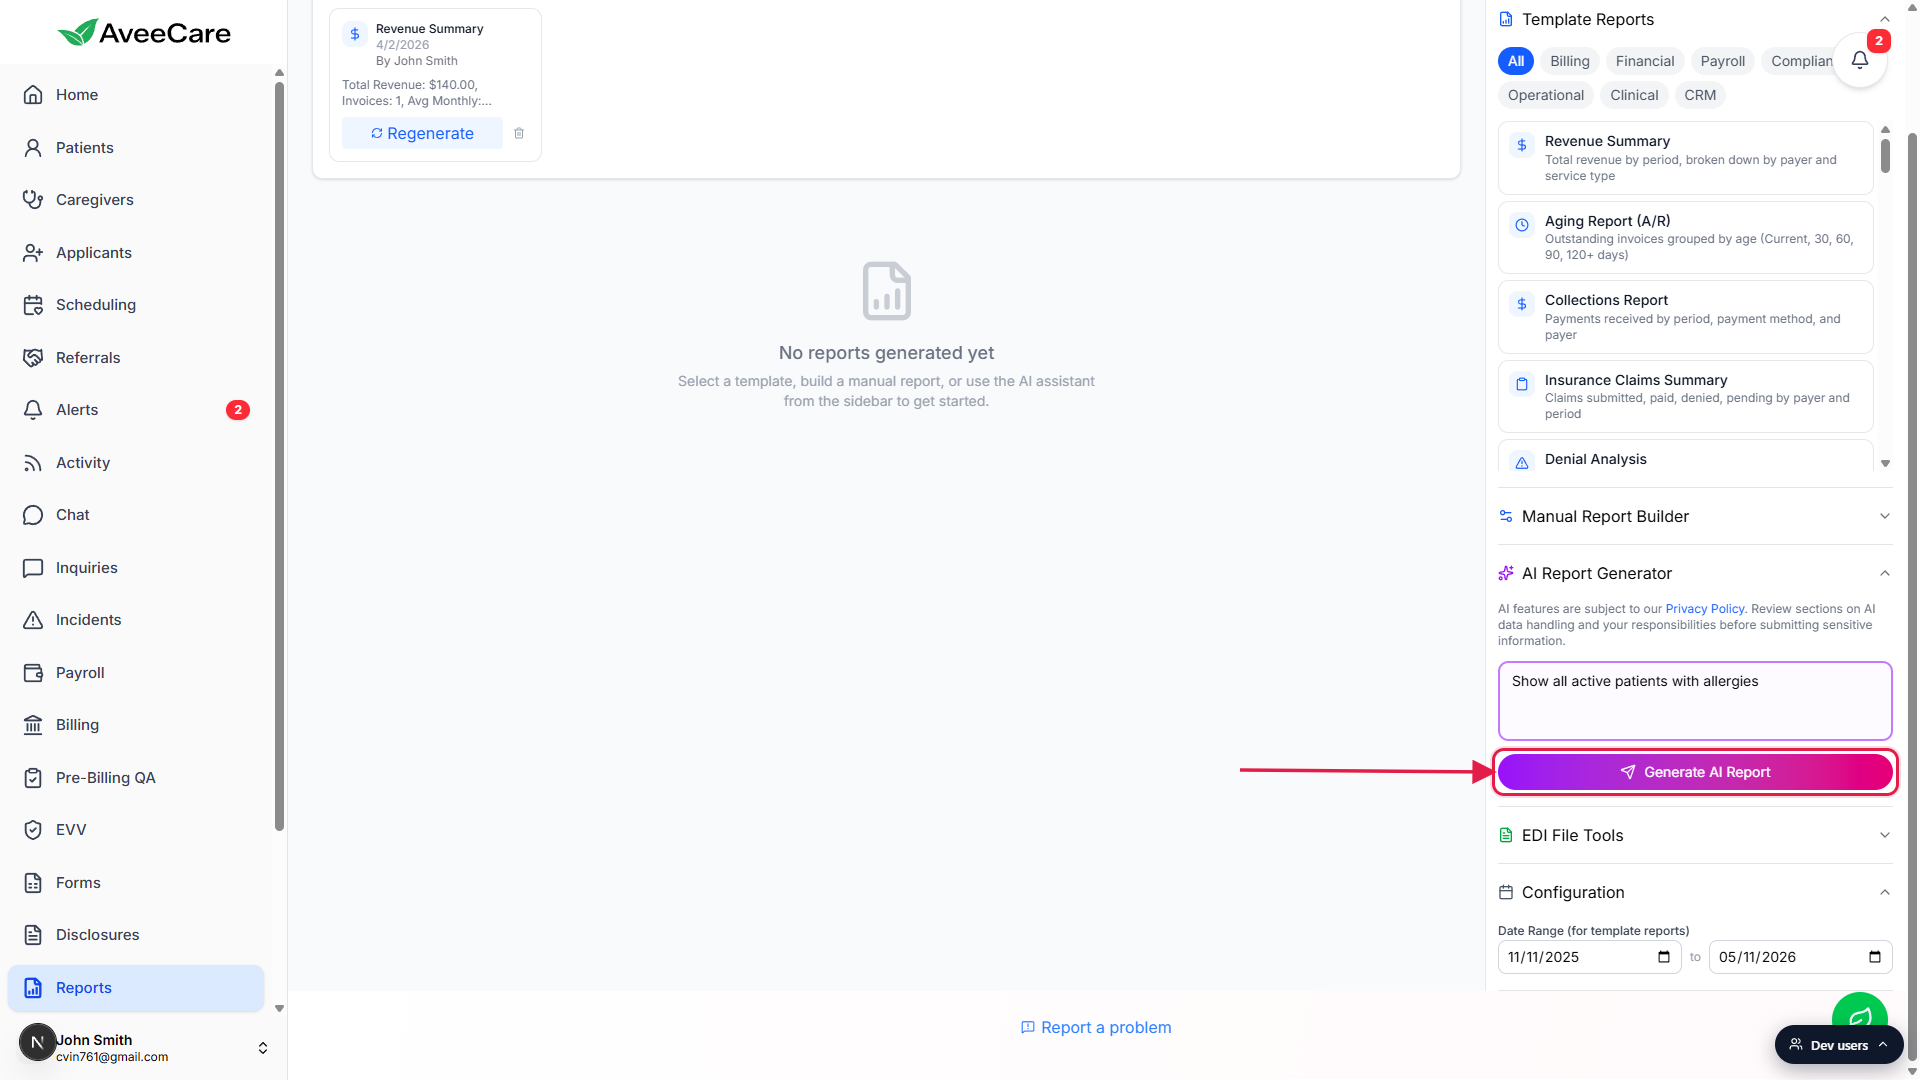
Wait for the result to render in the canvas.
Simple lookups land in a few seconds; complex queries can take up to a minute. If AveeCare cannot answer the prompt confidently, you see an inline error explaining what was missing, and the prompt is restored to the textarea so you can tweak it and run again.
4. Review the output and keep, print, or download it
Scan the result panel in the canvas.
AveeCare picks the right output shape on its own: a table for record lookups, a chart for distributions, or text for summaries. Tables come with sortable columns and pagination. Charts come with Total, Count, Average, and Growth headline tiles when those make sense.Use the row of icons in the top-right of the report card.
The card has Print, Download CSV, Download PDF, and Dismiss buttons. The first three keep the report as a file you can share. Dismiss removes the result from the canvas but the report stays in Recent Reports at the top of the page.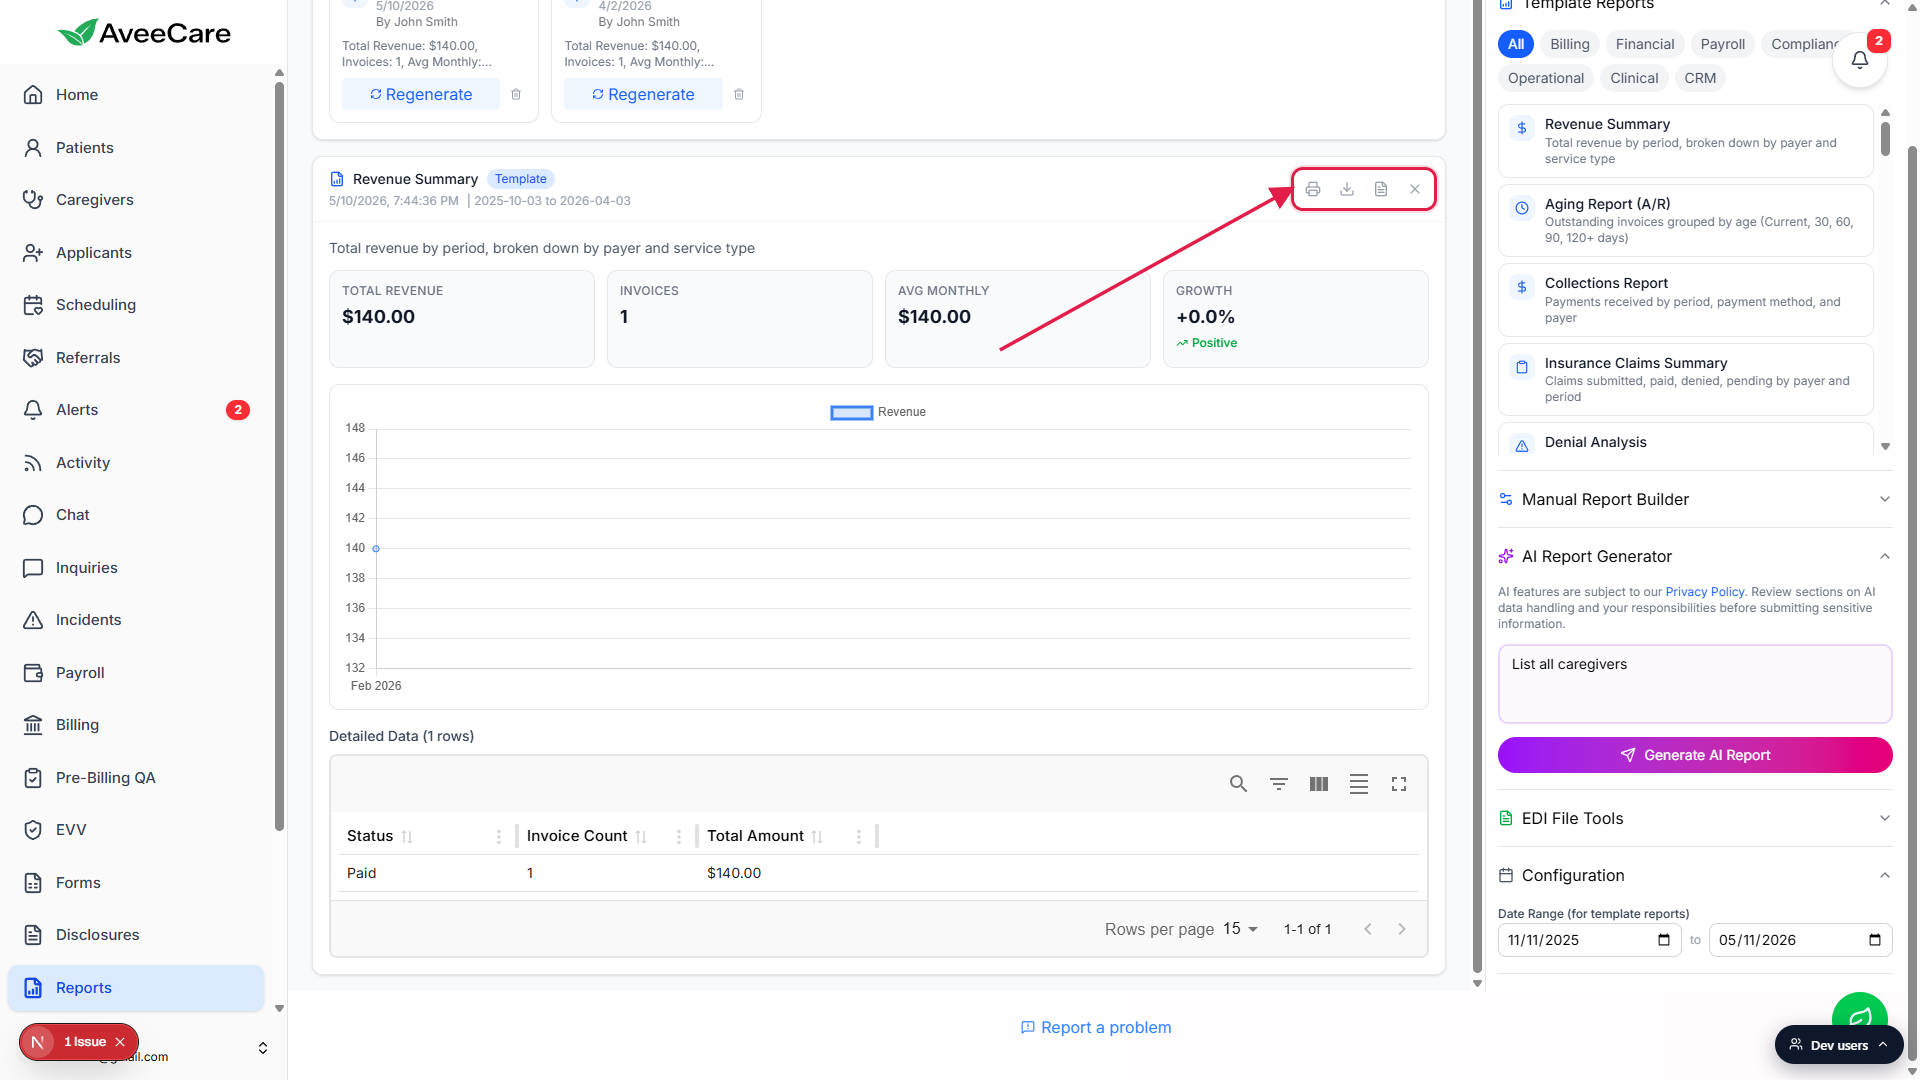
Find the report again in Recent Reports.
Every report you run, AI or template or manual, is saved to the Recent Reports row at the top of the page. Click any card to bring it back into the canvas, or click Regenerate to rerun the same prompt against current data.
Common pitfalls
- Vague prompts. “Show me a report” gives you a random table. Name the entity (patients, visits, claims, caregivers), the metric (count, total, average), and the time window. The more specific the prompt, the more reliable the result.
- Asking for fields AveeCare does not have. The AI is constrained to your tenant's data model. If you ask for a column that does not exist (for example, a custom HR field), the AI will tell you it cannot find that field rather than make one up.
- Complex multi-join requests on the first try. Prompts that cross three or more entities (for example, patients + visits + claims + payroll) sometimes need two passes. Start with the simpler version, then add a follow-up prompt that refines the result.
- Forgetting that Dismiss is not Delete. Dismiss only clears the result from the canvas. The report is still in Recent Reports and the prompt is still logged for audit. To remove a saved report, use the trash icon on the Recent Reports card.
- Looking for a Save button. There is no separate Save step. AveeCare saves every generated report to Recent Reports as soon as it renders, so the “save” action you might be hunting for has already happened.