Alerts is the patient-side inbox for important messages the agency wants you to see. Each alert appears as a color-coded card with a severity icon, a short title, a description, and the time it was created. The page shows alerts about your visits, your billing, and your care directly. When the office or system reviews an alert, a green Reviewed chip appears next to the timestamp.
Quick answer
Open Alerts from the Patient Portal sidebar. Cards sort newest first. Red icon means Critical, orange means Important, blue means Notice. A green check with Reviewed shows when staff or the system has reviewed an alert. The page shows a friendly empty state when there is nothing to show.
1. Open Alerts from the Patient Portal sidebar
Click Alerts in the Patient Portal left sidebar.
The sidebar entry shows a bell icon. The Patient Portal sidebar order is Dashboard, Timeline, Visits, Billing, Inquiries, Alerts, Settings. The unread count on the dashboard mirrors the alerts count, so you can also jump in from the Unread stat card on your dashboard.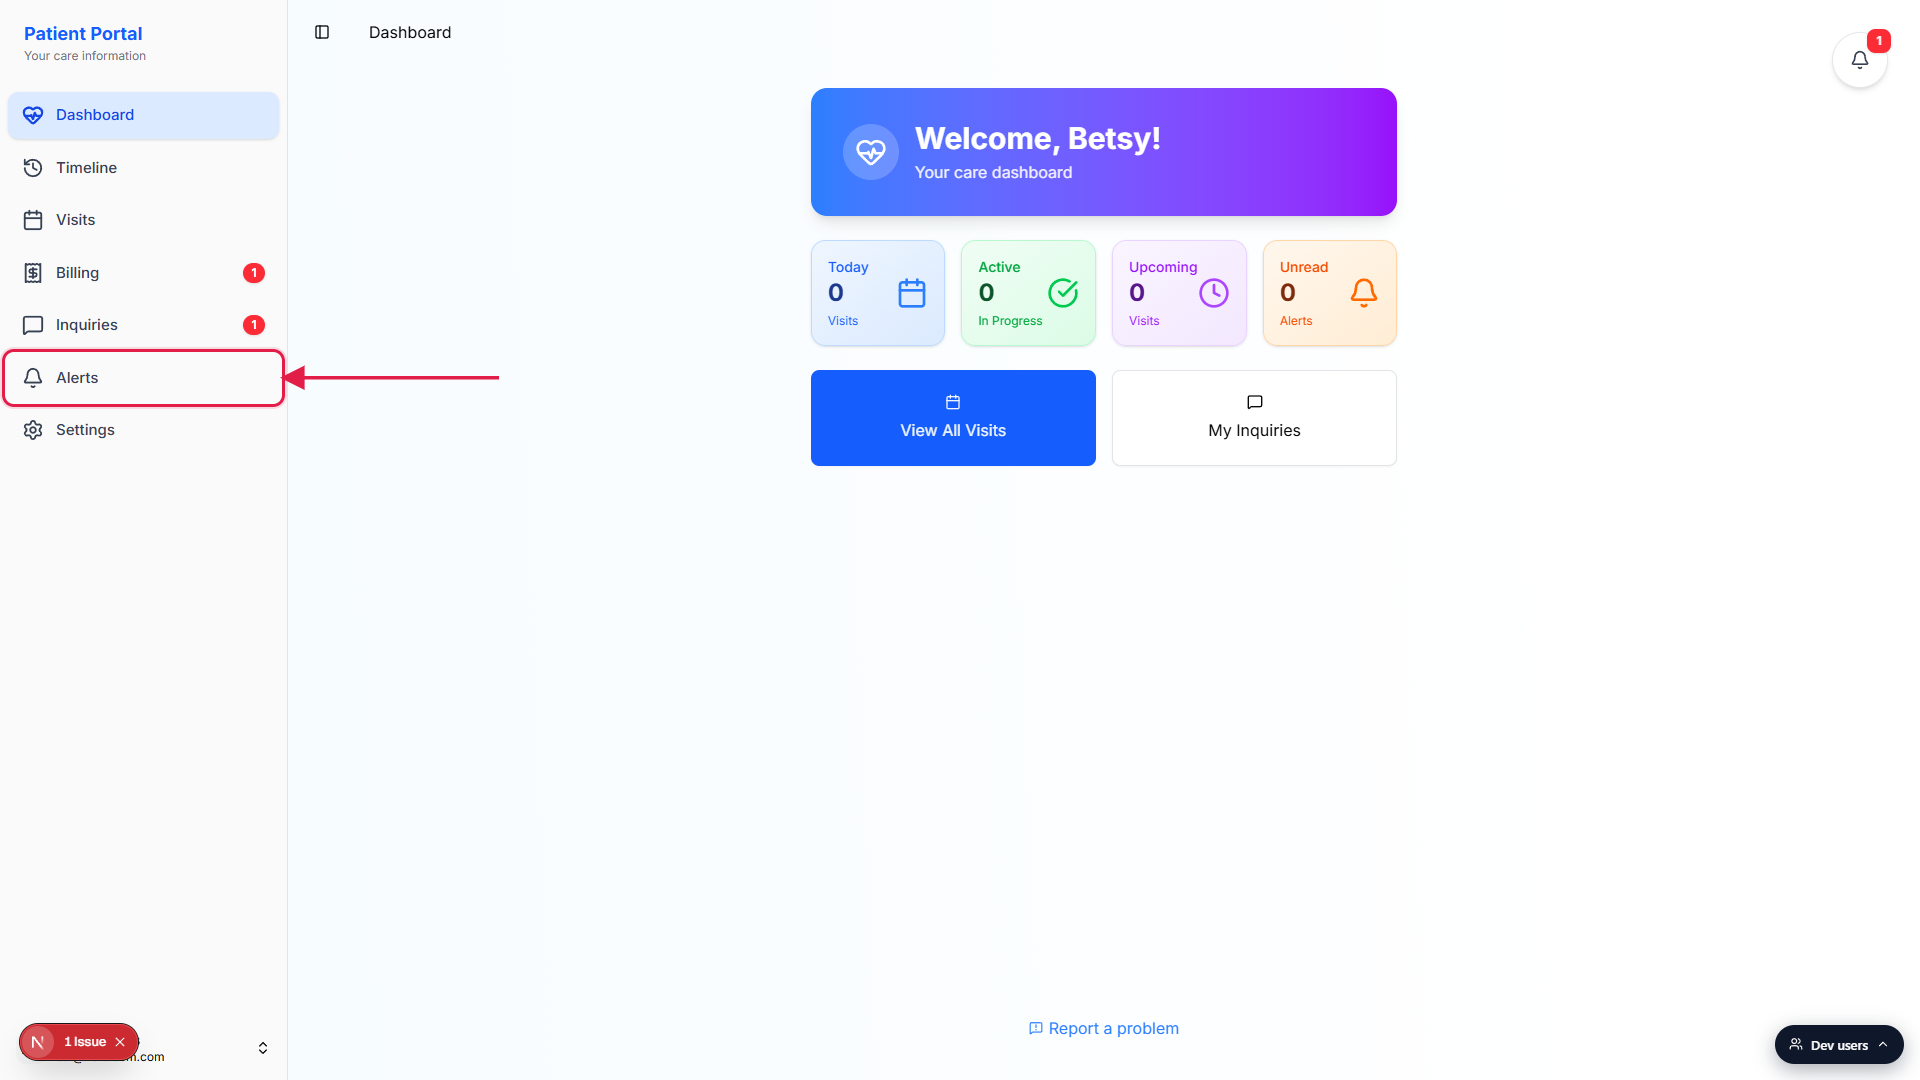
The page title reads Alerts.
The header is a single bold Alerts title. Below it is a vertical list of alert cards, one per alert, sorted newest first by their creation time.
2. Read each alert card
Cards are color-tinted by severity.
Critical cards have a red border and a light red background. Important cards have an orange border and a light orange background. Notice cards have a blue border and a light blue background. The whole card carries the color so a Critical row never gets lost in a busy list.Each card shows icon, name, type pill, description, and time.
On the left of each card is a colored severity icon: a red warning triangle for Critical, an orange bell for Important, a blue info circle for Notice. To the right of the title is a small pill with the severity name (Critical, Important, or Notice). Below the title is the alert description, and below that is the time the alert was created in your local timezone.When the list is empty, you see a centered "No alerts yet" card.
The empty state is a single centered card with a gray bell icon, the headline No alerts yet, and the line You will receive important updates here. Most patients see this most of the time, which is by design. The page only fills up when something actually needs your attention.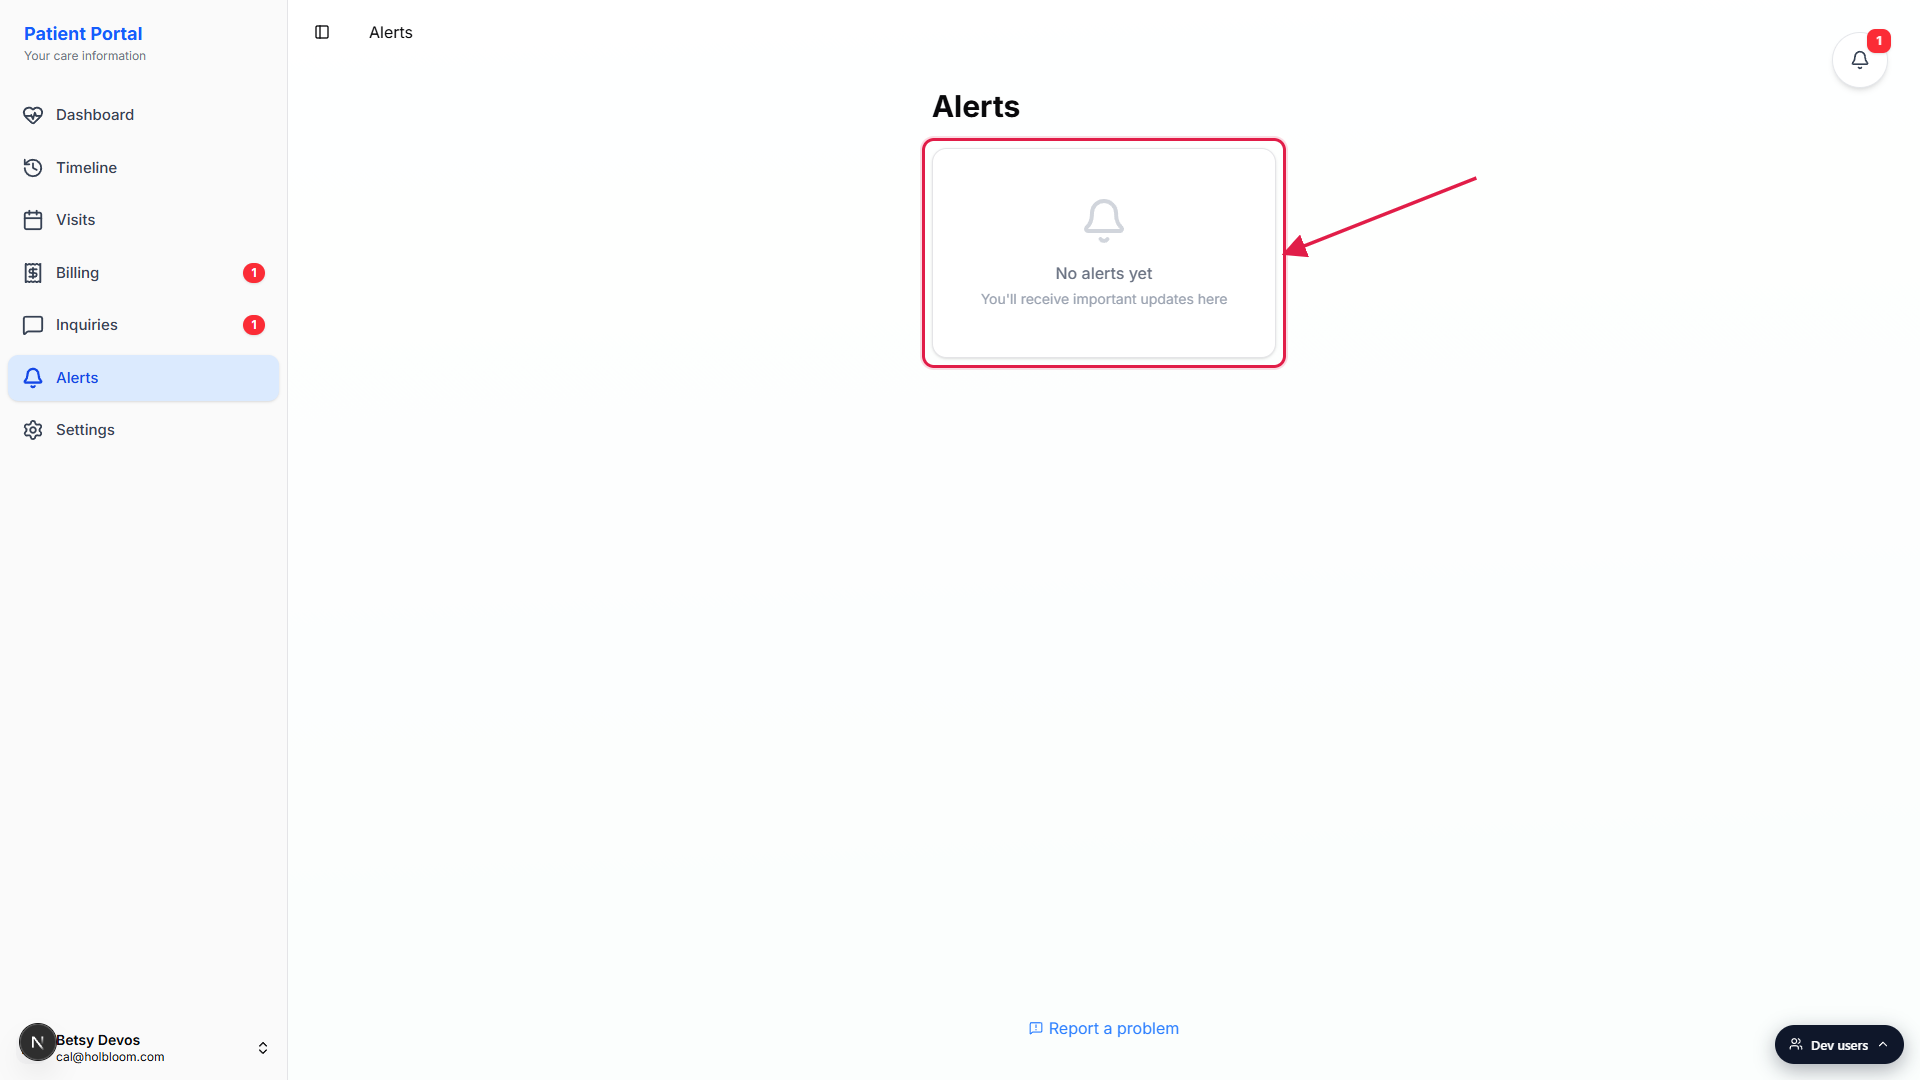
3. Recognize the severity color
Red triangle and red pill mean Critical.
Critical alerts are for things that need attention right away. Examples include a missing EVV PIN on the day of a visit, an invoice that has gone overdue, or a flagged incident on one of your visits.Orange bell and orange pill mean Important.
Important alerts should be handled today but are not emergencies. Examples include a schedule change for a visit, an inquiry reply from staff, or a billing reminder ahead of a due date.Blue info circle and blue pill mean Notice.
Notice alerts are informational. You do not need to act on them. Examples include a heads-up about a new caregiver joining your care team, or a confirmation that a recent payment posted.
4. Watch for the Reviewed chip
A green check and the word Reviewed mean staff or the system has looked at the alert.
The chip sits to the right of the timestamp on a card. When an alert has not yet been reviewed, only the timestamp shows. When the alert is reviewed, the green check and the word Reviewed appear next to it.You can see when alerts surface on the dashboard too.
The patient dashboard has an Unread stat card with a bell icon and a count. That count matches the number of unread alerts on the Alerts page. When the page is empty the count is zero.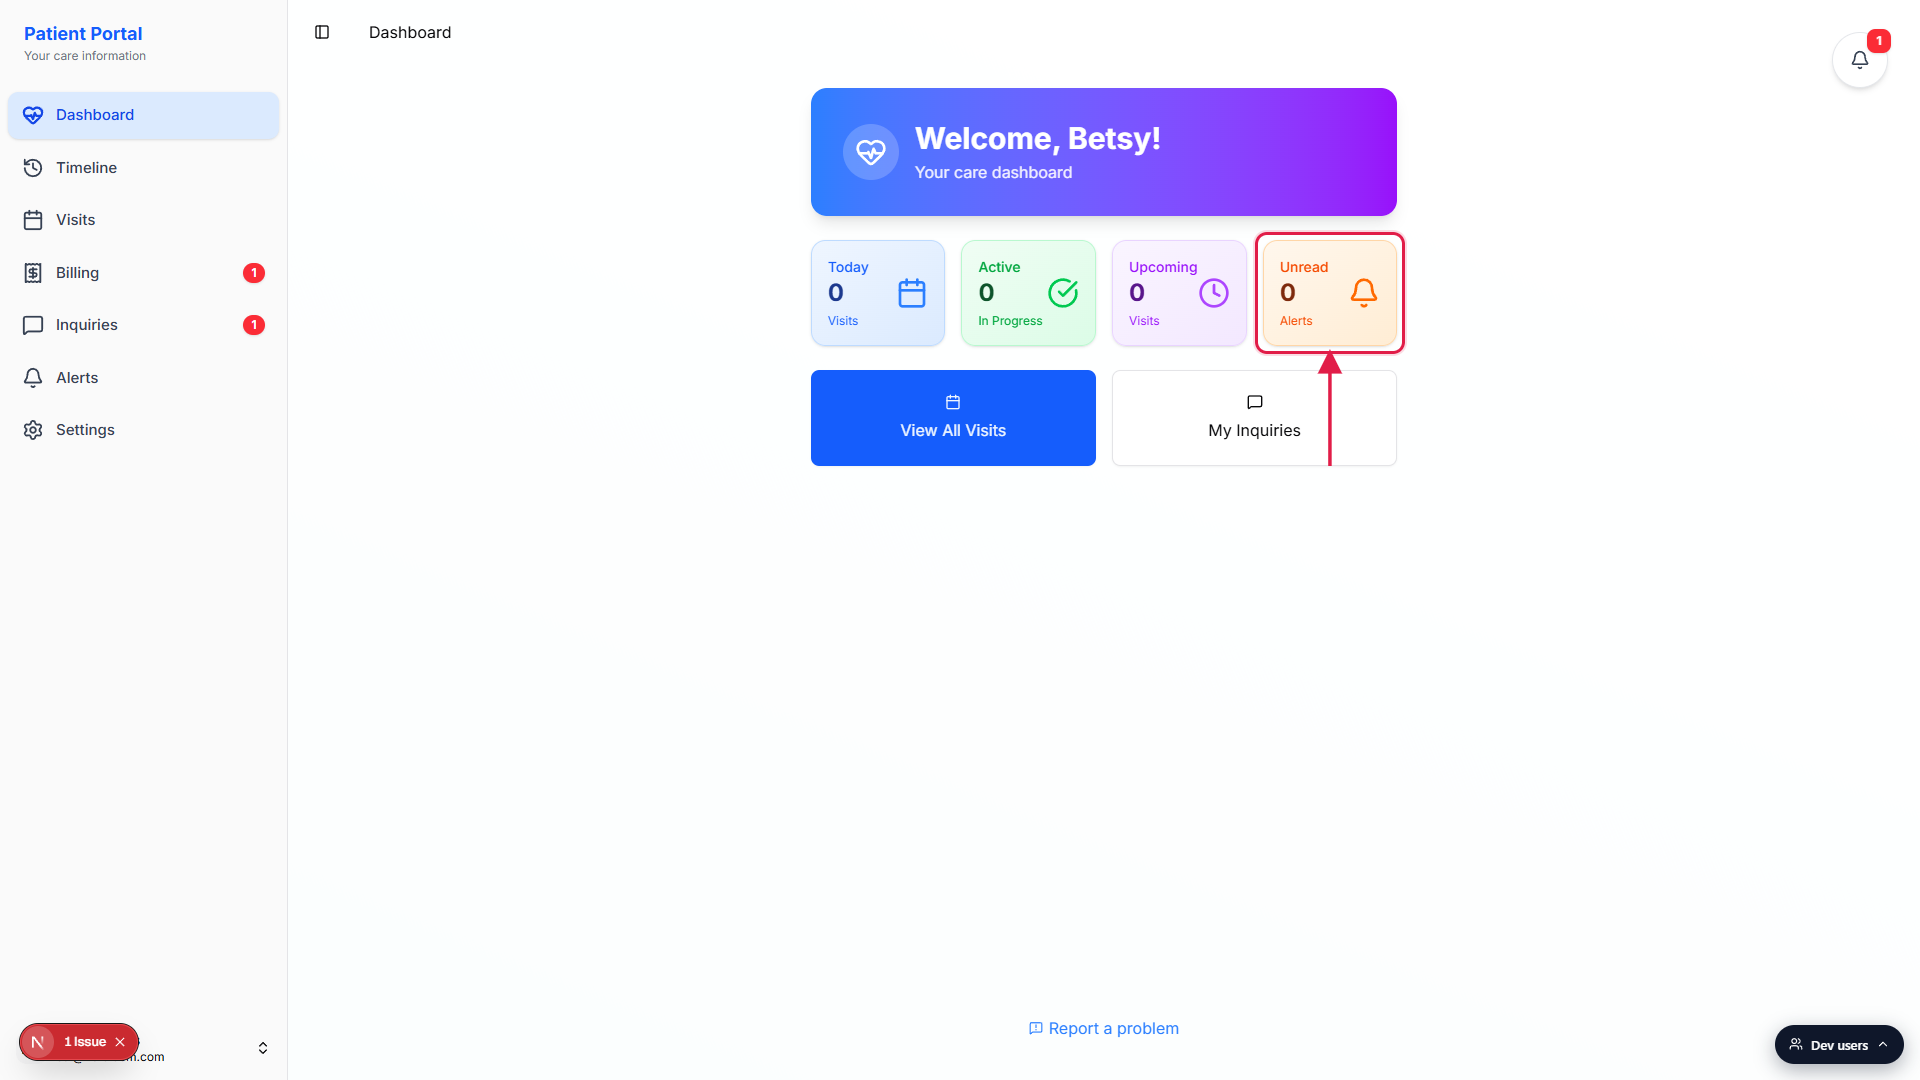
What each severity means
The three severities follow the same scheme everyone in the agency uses, so a Critical alert on your side is a Critical alert on the office side too.
- Critical (red). Action is needed now. The team is already on it on their end.
- Important (orange). Action is needed today. Most billing and schedule items land here.
- Notice (blue). For your information. Confirmations and heads-ups.
Common pitfalls
- Treating Alerts as a chat. Alerts is a one-way inbox. To message the office, use Inquiries instead. The Alerts page itself does not have a reply box.
- Missing the dashboard Unread card. The dashboard shows an Unread stat card with a bell icon and a count. Some patients only check the sidebar and miss the at-a-glance number on the dashboard. Both surfaces show the same count.
- Expecting alerts to auto-clear by scrolling. Alerts stay visible on the page until they are reviewed by staff or the system, or until the underlying issue resolves (an overdue invoice gets paid, a missing PIN gets set). Scrolling past a card does not change its state.
- Confusing the bell badge with the alerts count. The top-right floating bell on every page shows your general notifications, which includes inquiry replies and visit events. The Unread Alerts card on the dashboard shows only the alerts inbox count. The two numbers can differ.
- Looking for office-wide alerts. The Patient Portal Alerts page is filtered to alerts that touch you, your visits, or your care. Office-wide alerts about all patients live on the staff side. If you expect to see something and do not, the office is likely seeing it on their staff-side Alerts view.