The home dashboard at /home is the landing page every signed-in admin sees first. It surfaces the things you usually want to check before anything else: agency-wide KPI counts, today's scheduled visits, a 7-day trend, the latest activity, and warning panels for alerts, birthdays, expiring credentials, care plan reviews, and overnight inquiries. Read top to bottom and you've already triaged the morning.
Quick answer
Open /home from any page (or click the AveeCare logo in the sidebar). The dashboard refreshes its data every time you land. Skim top to bottom: quick links, KPI tiles, Today's Visits and the chart band, Recent Activity, then the warning panels at the bottom. Anything red or with a count badge wants you today.
1. Skim the quick-link cards and the welcome banner
Three quick-link cards span the full width across the top.
Patients, Caregivers, and Scheduling are oversized tap targets that jump you straight to the area you want to work in. Each card has a short subtitle (Access patient records, Manage caregivers, Manage appointments) so a new admin knows what each section does.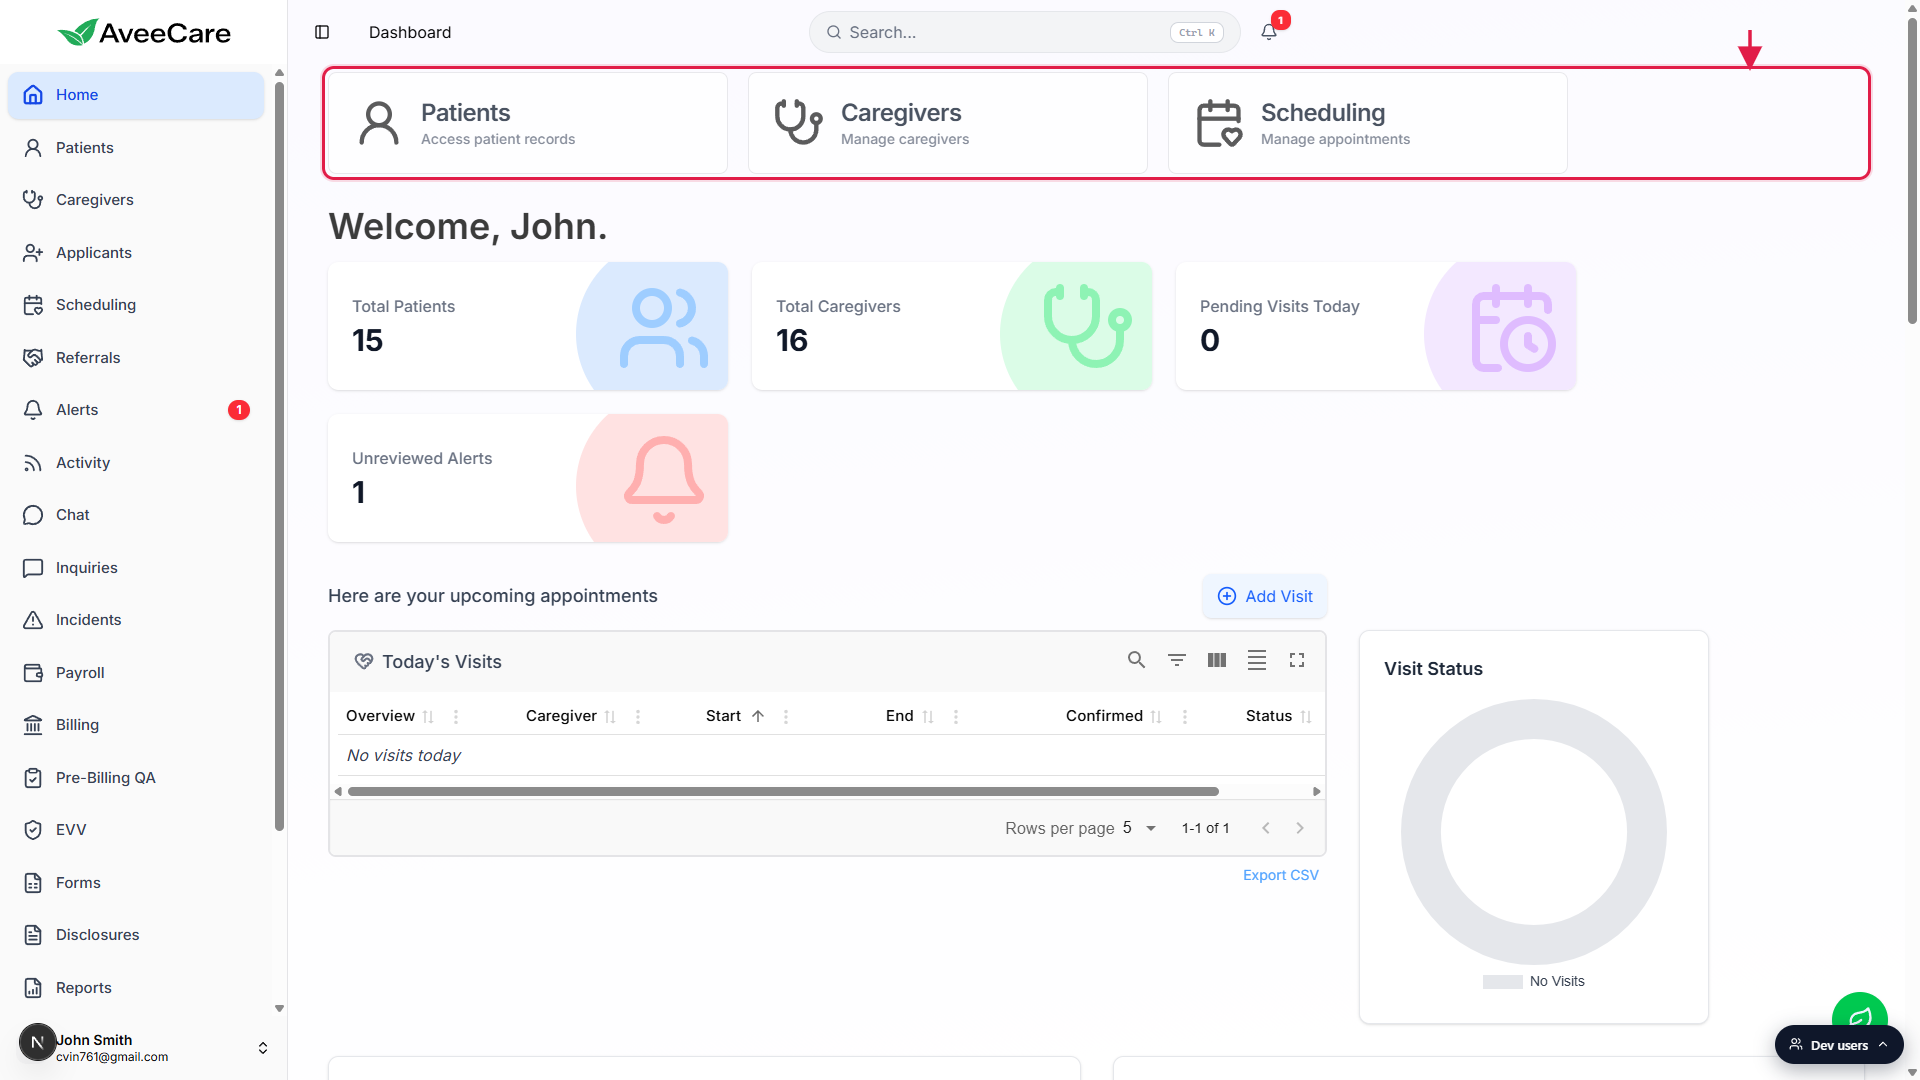
A Welcome banner with your first name sits underneath.
It reads Welcome, <first name>. in a big serif weight. No action lives on it, it just sets the page.
2. Read the four KPI tiles for the shape of the day
Four count tiles below the welcome banner.
Total Patients, Total Caregivers, Pending Visits Today, and Unreviewed Alerts. Counts are live, not nightly snapshots. On wider screens they sit in one row, on smaller screens they wrap. See the dedicated KPI tiles guide for what each one counts and what it does not.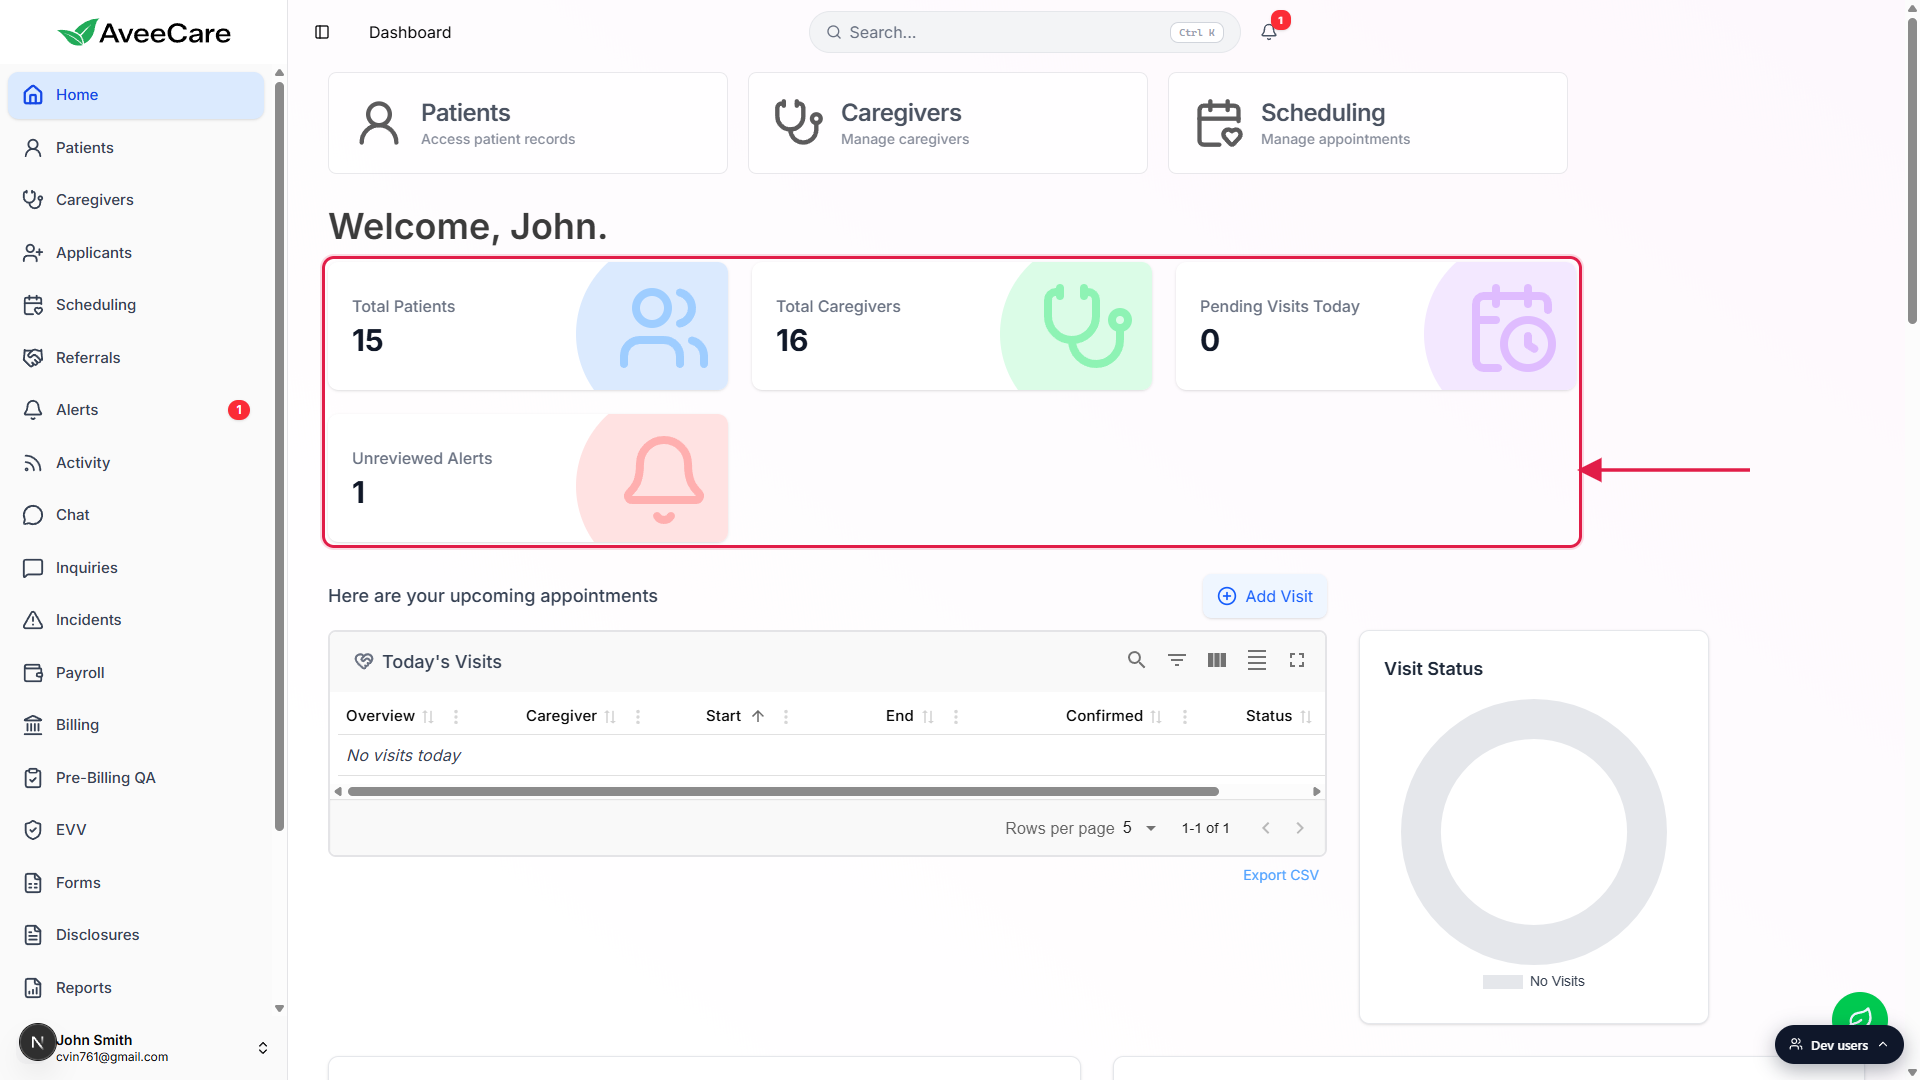
Pending Visits Today only counts not-started future visits.
Visits already In Progress or Completed do not count as Pending. If your day is half done and the tile reads 0, that is a good sign, not a bug.Unreviewed Alerts only counts alerts no one has clicked.
Open/alertsfor the full list (read and unread). The KPI tile is the unread badge.
3. Work Today's Visits and the chart band
Today’s Visits sits next to the Visit Status doughnut.
The widget lists every visit scheduled for today. Toolbar buttons in the header give you search, filter, density, column pick, and fullscreen. The doughnut on the right breaks the same visit set down by status. No visits today is what you see if nothing is on the books.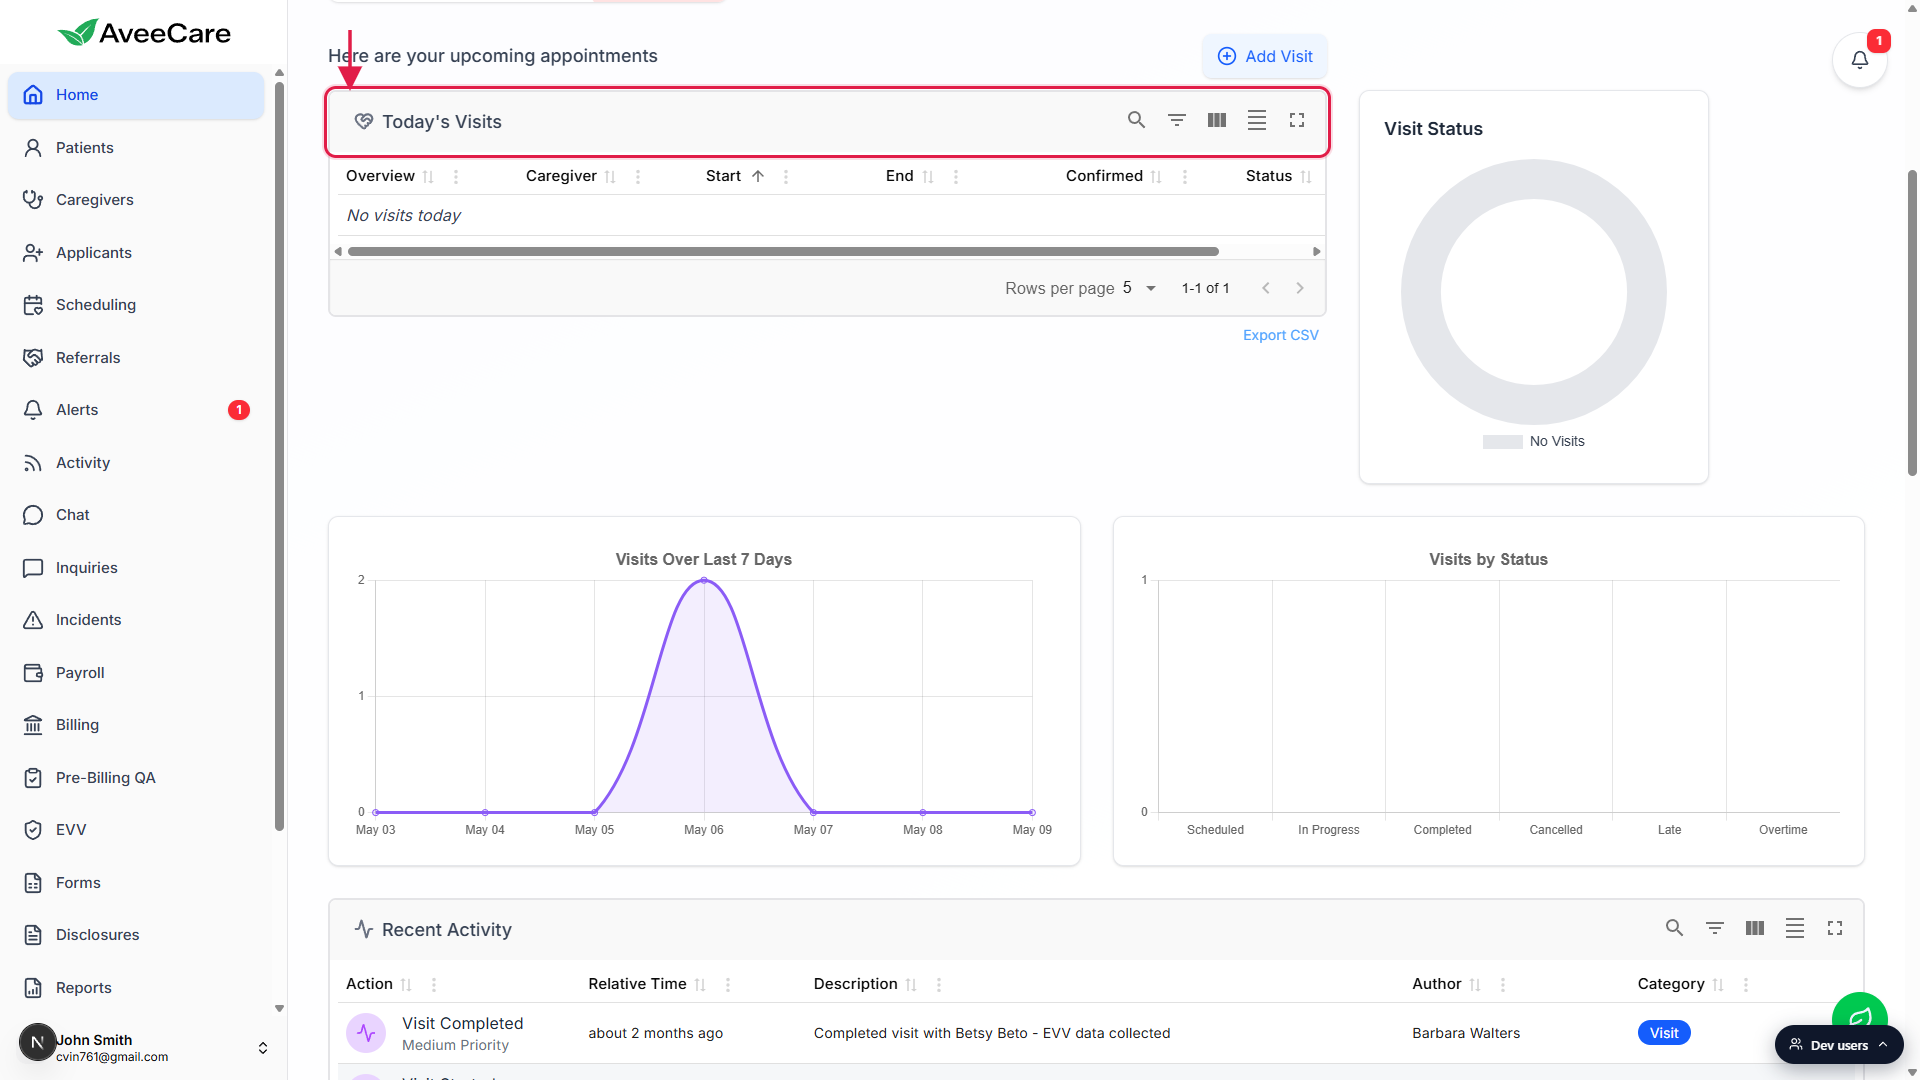
Two trend charts run below it.
Visits Over Last 7 Days is a line of daily visit counts so you can feel whether scheduling is climbing or quiet. Visits by Status is a bar chart broken out into Scheduled, In Progress, Completed, Cancelled, Late, and Overtime. The bars show last week’s composition at a glance.Recent Activity logs Visit Started and Visit Completed events.
Newest first. Each row shows the action, when it happened, a short description (caregiver, patient, EVV verification method), the author, and a category pill. Use it to confirm caregivers actually clocked in this morning without leaving the dashboard.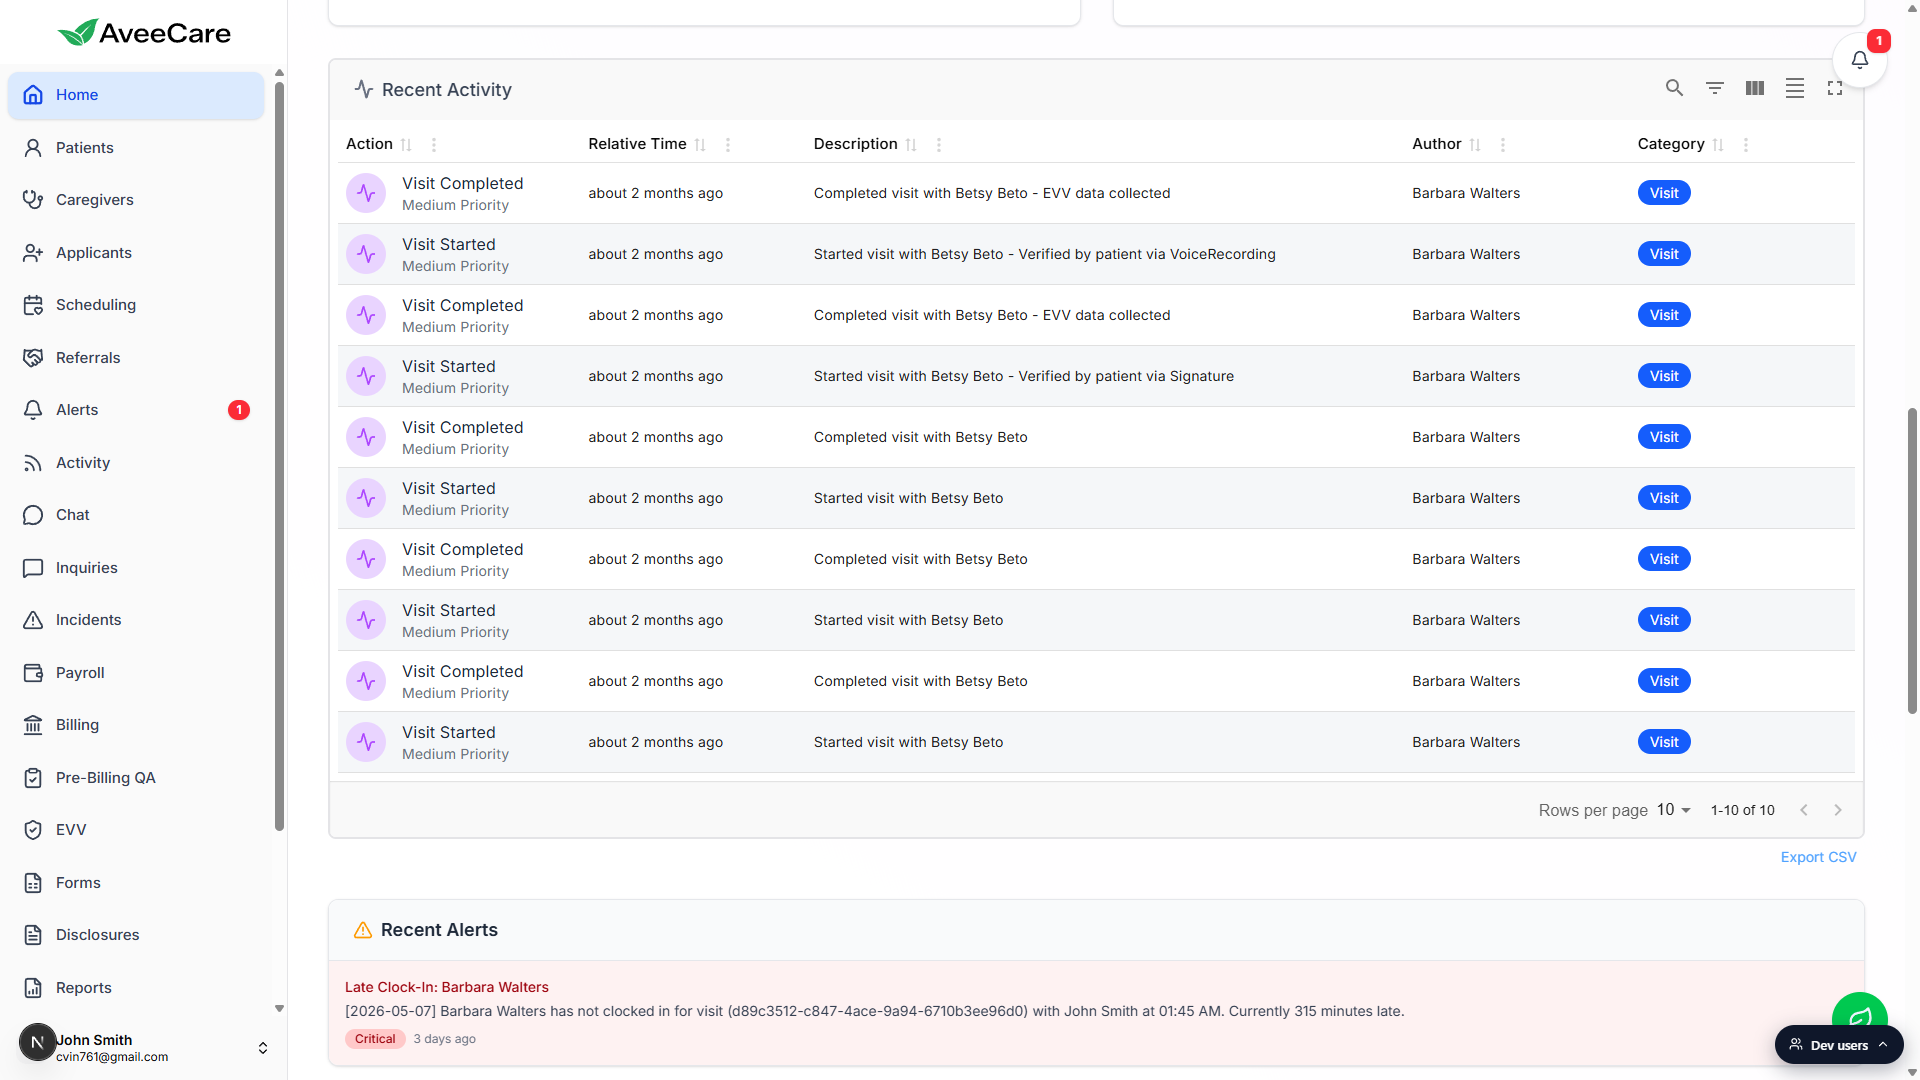
4. Scroll the bottom warning panels
Five panels stack at the bottom of the page.
Recent Alerts, Upcoming Patient Birthdays, Credential Expirations, Care Plans Due for Review, and New Overnight Inquiries. They exist to catch the things people forget. Always scroll all the way down, anything red or with a count badge wants you today.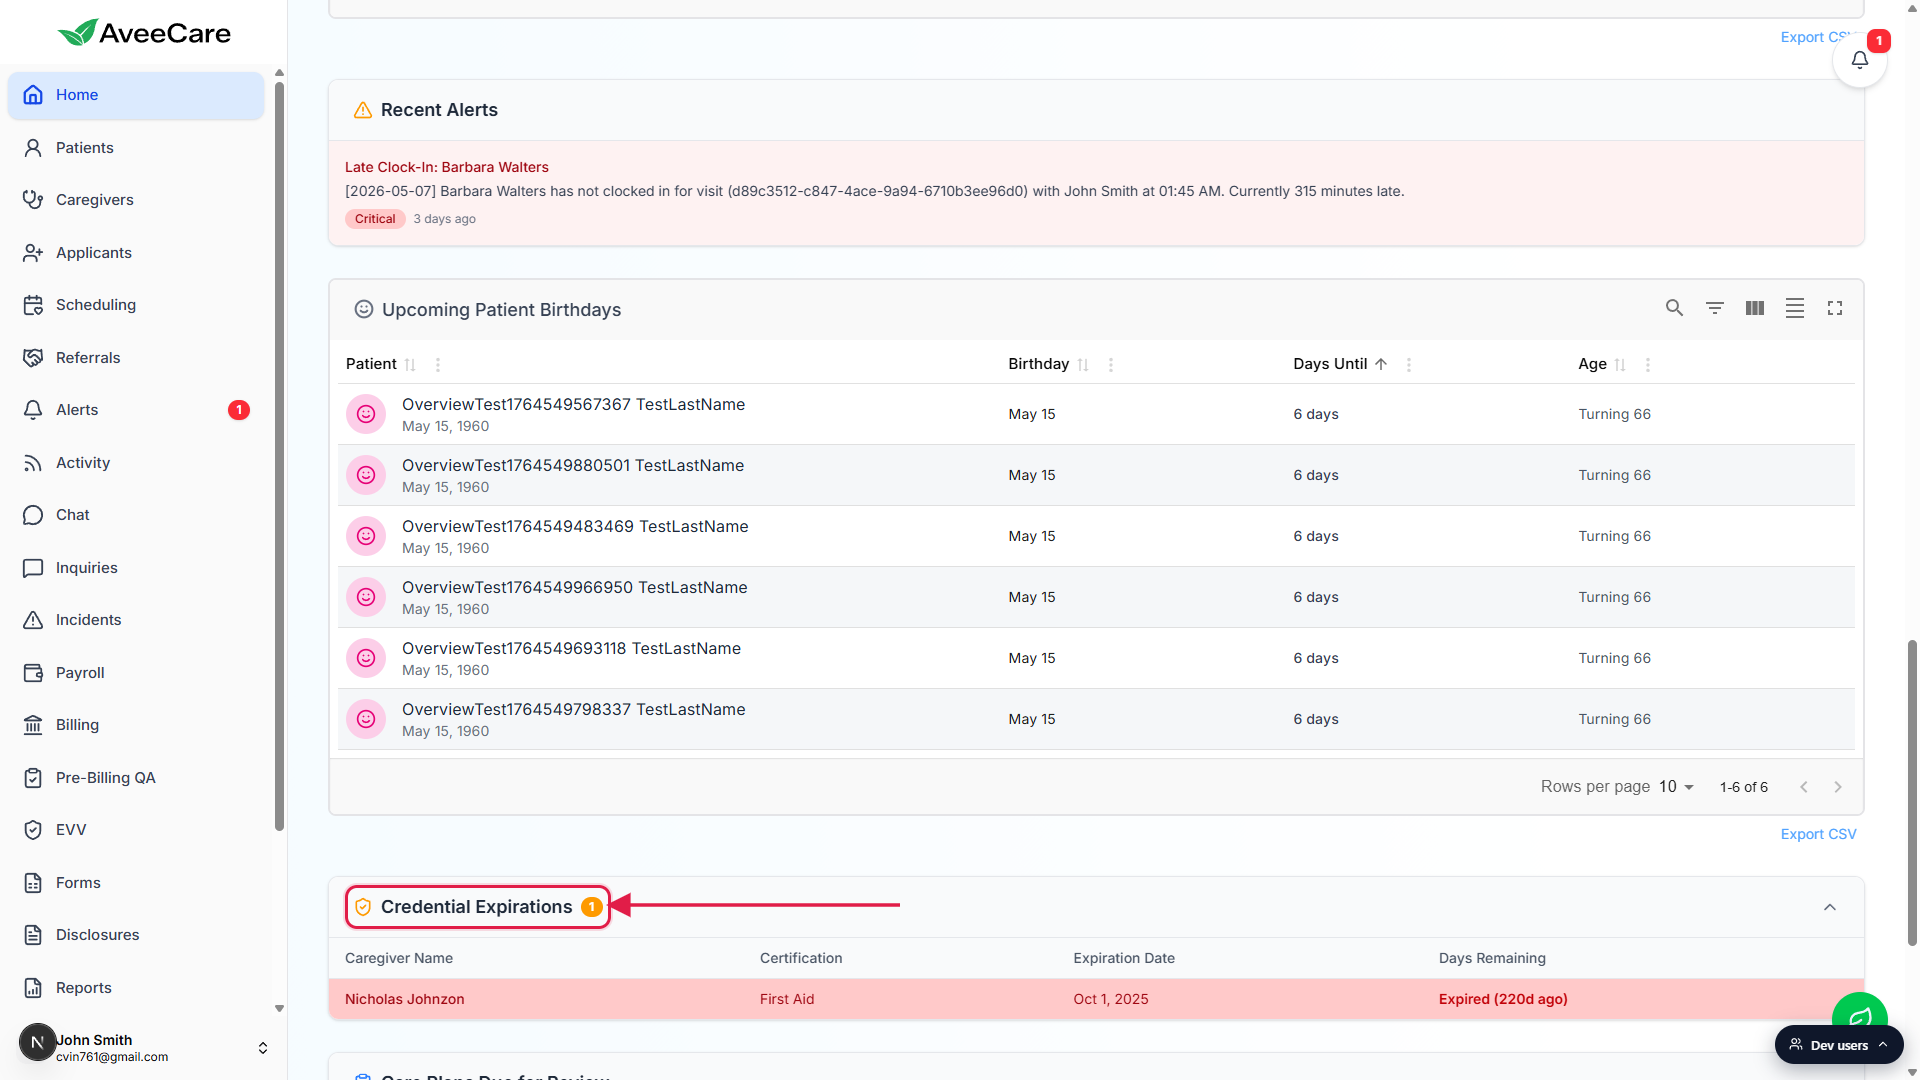
Credential Expirations is the highest-impact panel.
A red row means a caregiver certification has already lapsed and they should not be on the schedule. Click into the caregiver and renew before their next visit. The panel header carries a count badge so you do not have to scroll past it to know whether anything is wrong.Care Plans Due for Review and Overnight Inquiries fill in over time.
Care plans surface here when their review date is approaching. New Overnight Inquiries collects after-hours patient inquiries so you see them the moment you sit down in the morning, instead of buried in the inbox.
A daily morning rhythm
The intended order:
- Land on
/home. Glance at the KPI tiles for the shape of the agency. - Read Today's Visits. Anything Confirmed: false? Follow up.
- Scroll to Recent Alerts. Act on Critical alerts first.
- Check Credential Expirations. Anything red? Open the caregiver and renew before their next visit.
- Skim Care Plans Due for Review and New Overnight Inquiries. Schedule the reviews. Reply to the inquiries.
- Then jump into the area you actually need to work in for the day.
How it differs by role
The dashboard described here is the Admin / RootUser / User view. Caregivers see their own caregiver dashboard instead, focused on their own visits and clock-in actions, no agency-wide KPIs. Patients see the patient portal with their own visits and inquiries. So if your screen looks nothing like the shots on this page, double-check which dev user you are signed in as.
Common pitfalls
- Empty dashboard on a new tenant. Most panels are empty until you have patients, caregivers, scheduled visits, alerts, and credentials in the system. As you build out your data, panels populate. Do not assume something is broken on day one.
- Ignoring the warning section because it is below the fold. Credential Expirations and Care Plans Due for Review live at the bottom of the page. Always scroll all the way down, otherwise you will miss the things designed to be impossible to miss.
- Looking for a setting on the dashboard. The dashboard is read-only. Anything you want to configure (notifications, EVV, billing defaults) lives under Settings.
- Confusing “Unreviewed Alerts” with “all alerts.” The KPI tile counts only alerts no one has clicked. The full alert list lives at
/alerts. - Trying to clock in or edit a visit from Today's Visits. The widget is a read-only view. Clicking a row opens the visit detail. To start, edit, or cancel a visit, use the Scheduling page.