Heads up: the dashboard at /home does not show a standalone earnings or revenue chart in the current build. The at-a-glance KPIs on Home are visit counts, not dollars. For revenue figures, the right surfaces are the Billing stat cards (live unbilled, estimated, billed) and the Revenue Summary template on the Reports page (trends and slices by payer or service type).
Quick answer
For exact figures right now, open Billing and read the Estimated Revenue stat card. For a trend over an arbitrary date range, open Reports and click the Revenue Summary template, or ask the AI Report Generator for a custom revenue chart.
1. Confirm the dashboard does not show revenue
Open Home and look at the top KPI row.
The four cards at the top of/homeare Total Patients, Total Caregivers, Pending Visits Today, and Unreviewed Alerts. None of them show dollars. Below that you get a Visit Status donut, a Visits Over Last 7 Days line chart, and a Visits by Status bar chart. All visit volume, not revenue.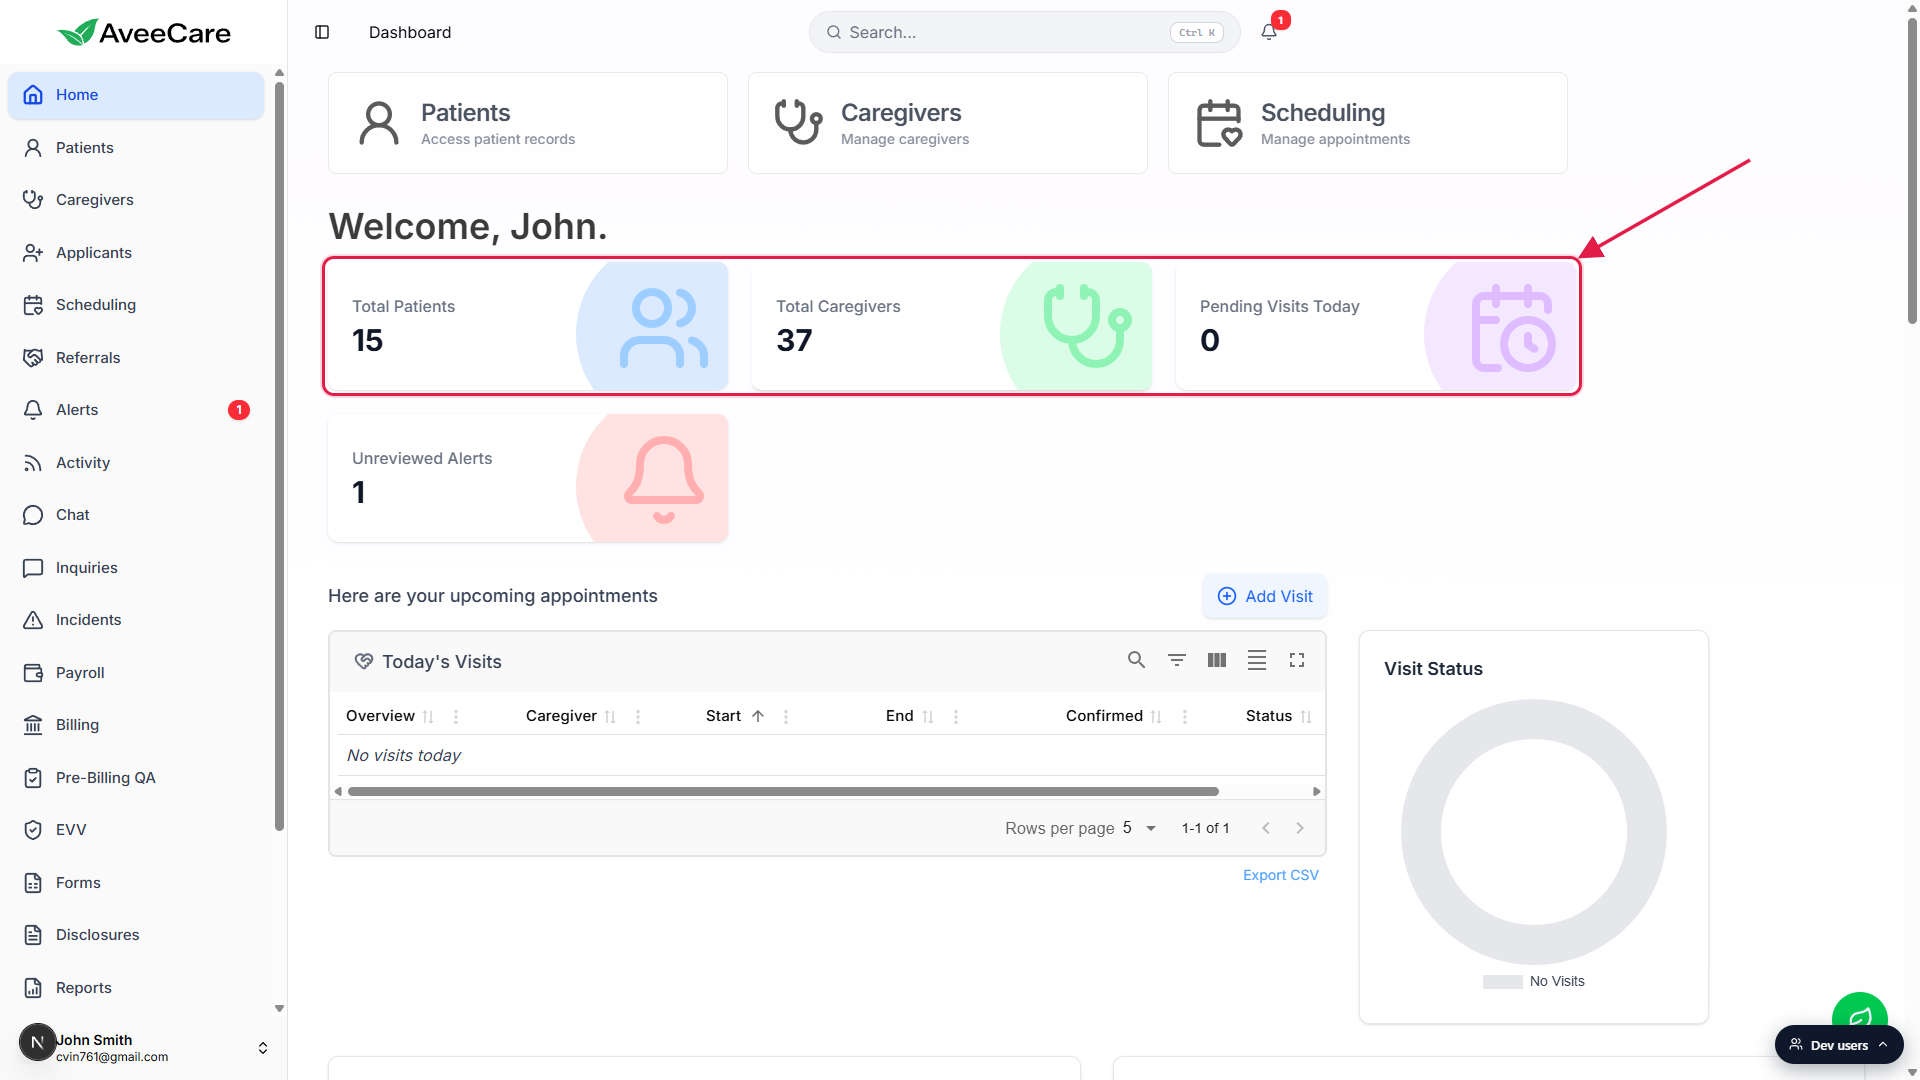
If you came here looking for a revenue chart, jump to Billing or Reports.
Both surfaces are linked from the left sidebar. Billing is the single-page summary; Reports is where any chartable revenue view actually lives.
2. Read the Billing stat cards for live numbers
Click Billing in the sidebar.
The Billing page header shows four stat cards across the top: Unbilled Visits, Estimated Revenue, Billed Visits, and Active Patients. Below them sits a Date Range filter (All / 7 / 14 / 30 / 60 / 90 Days / 6 Months / 1 Year) plus custom date inputs.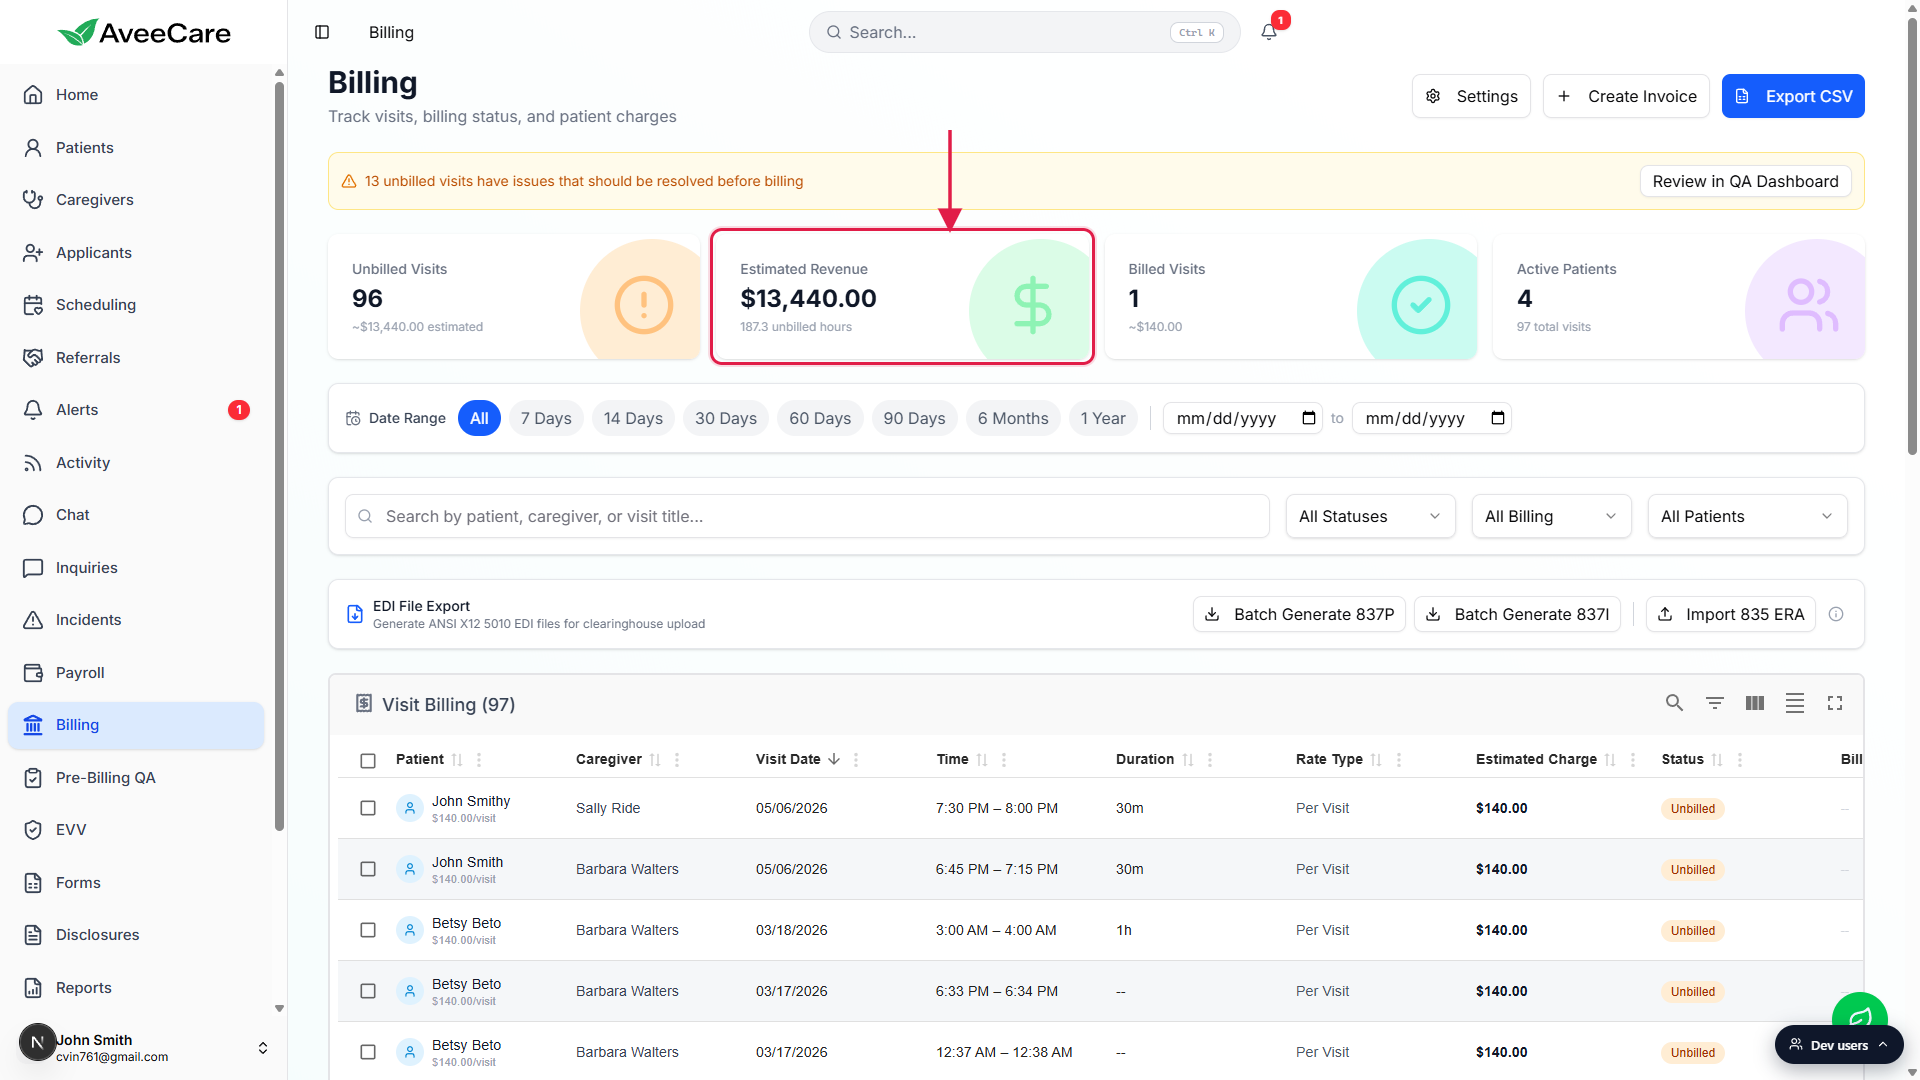
Estimated Revenue is the headline number.
It sums the rate times duration of every billable visit in the date range. The hint underneath (for example, 187.3 unbilled hours) tells you how much of that is still in the unbilled bucket vs. already on an invoice.Change the Date Range chips to retune the figure.
Click 7 Days for the past week, 30 Days for the trailing month, or pick custom from-and-to dates. The four stat cards recalculate as you change the range. The Visit Billing table below also filters down to the same window.
3. Use the Revenue Summary template on Reports
Click Reports in the sidebar.
Reports is split into three areas: a Recent Reports list at the top left, a No reports generated yet empty state in the middle if you have not built one yet, and a Report Tools panel on the right that contains Template Reports, Manual Report Builder, AI Report Generator, EDI File Tools, and Configuration.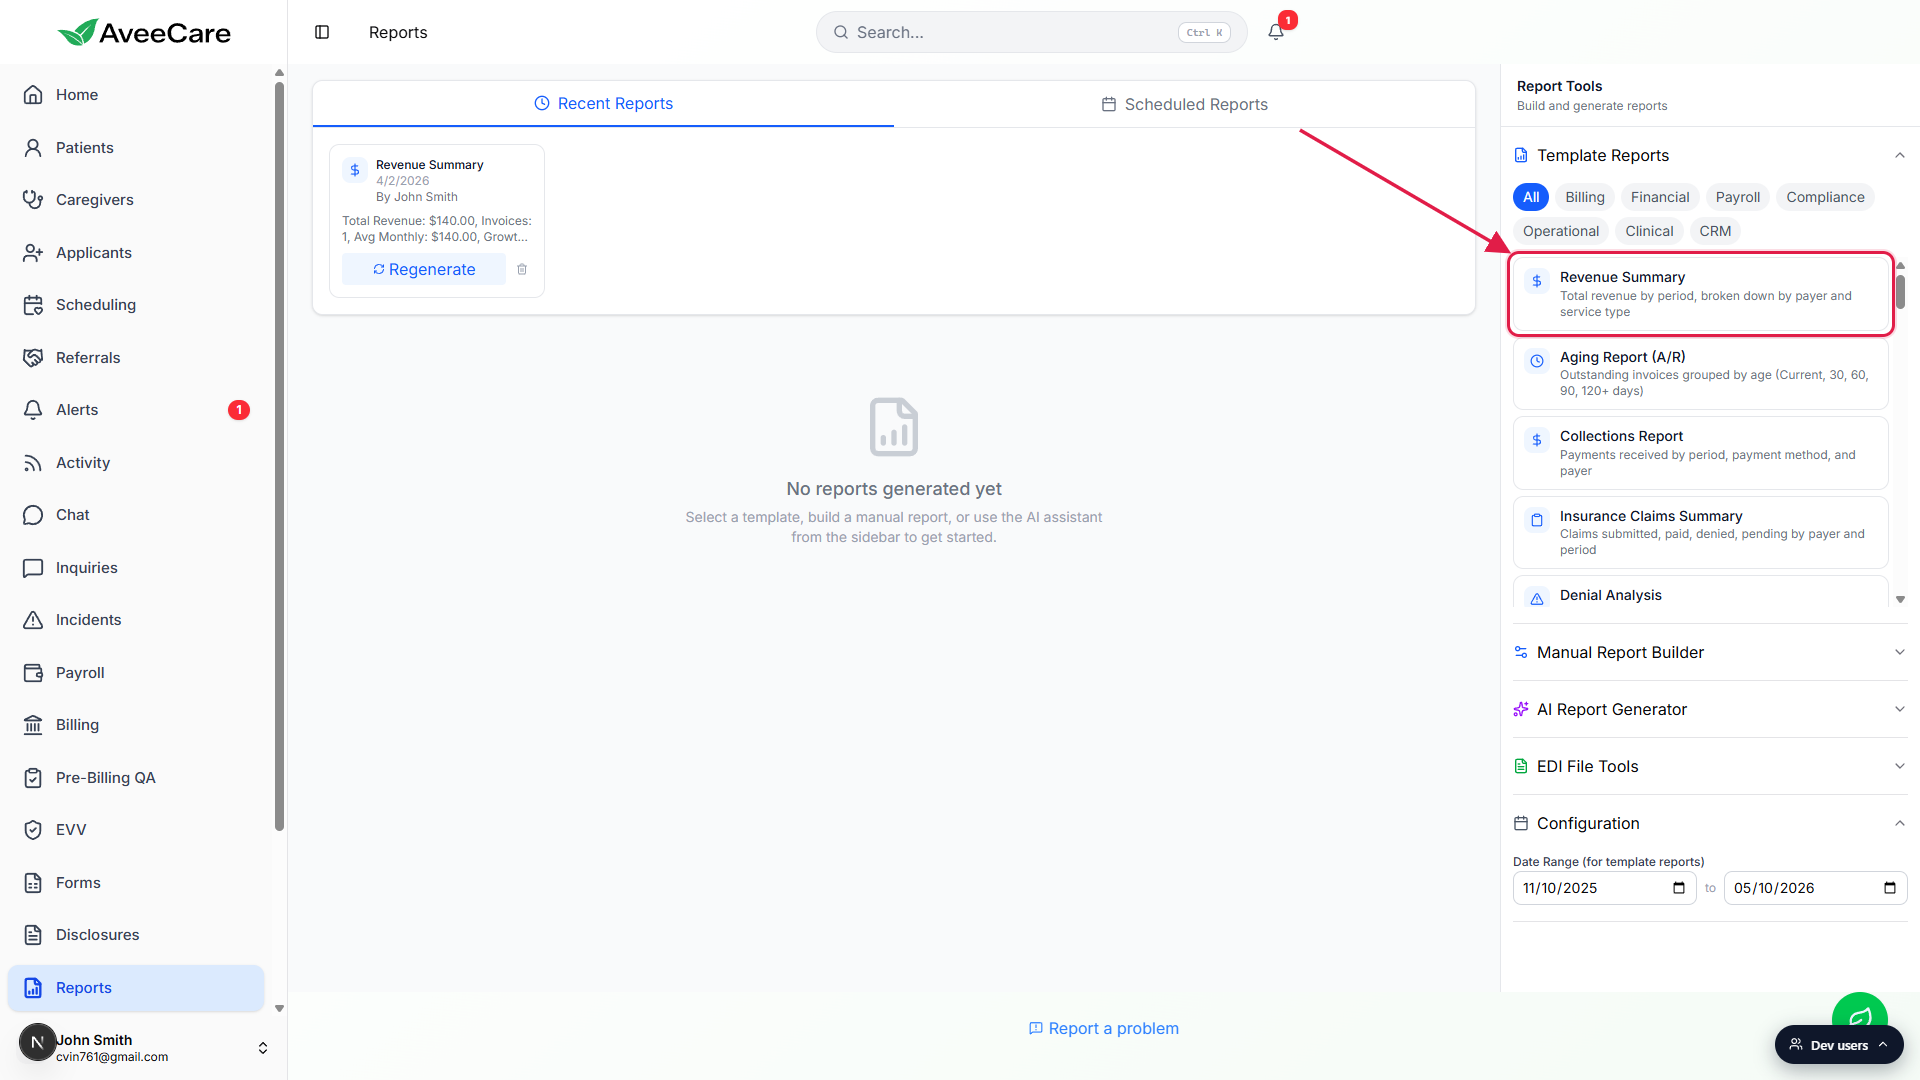
Open Template Reports and pick Revenue Summary.
Revenue Summary is the first card under Template Reports, with a dollar-sign icon. Below it are Aging Report (A/R), Collections Report, Insurance Claims Summary, and Denial Analysis. The category chips above (All / Billing / Financial / Payroll / Compliance / Operational / Clinical / CRM) filter the sidebar.Set the date range in Configuration and run it.
Configuration sits at the bottom of the Report Tools panel with a from-date and a to-date input. Default range is roughly the trailing 6 months. The output is total revenue by period, broken down by payer and service type. Each generated report lands in your Recent Reports list at the top.
4. Build a custom revenue report with AI
Expand AI Report Generator in the Report Tools panel.
It is below Manual Report Builder on the right side of the Reports page. The generator takes a plain-English prompt like "Show me revenue month over month for the last 6 months" or "Revenue by payer for Q1".Type the prompt and click Generate.
The AI drafts a report definition, runs it against your data, and saves the result to Recent Reports. From there you can rename it, regenerate with a new range, or schedule it.Open Scheduled Reports to deliver it on a cadence.
Switch the top tab from Recent Reports to Scheduled Reports to set up a weekly or monthly delivery by email. Useful for handing the agency owner a Monday-morning revenue snapshot without anyone touching the app.
How revenue is calculated
Both surfaces draw from the same visit and invoice data, so the numbers line up across pages:
- Estimated revenue. Visits with a rate configured contribute their rate times duration. This is what the visits should earn before invoicing.
- Billed revenue. Once invoices are generated for those visits, they roll into billed.
- Collected revenue. Once payments come in against the invoices, they roll into collected. Reports has a Collections Report template for that view.
- Cancelled visits do not count. Once a visit is cancelled, it leaves the dataset that powers the Estimated Revenue card and the Revenue Summary report.
Common pitfalls
- Looking for the chart on the dashboard. It is not there in the current build. The dashboard shows visit KPIs and warning panels, not dollars. Use Billing or Reports.
- Mixing up estimated and collected. Estimated revenue is what visit rates would produce. Collected revenue is what has actually been paid. Use Billing's stat cards plus the Collections Report template to tell them apart.
- Wanting per-office or per-payer slicing. The Billing page is agency-wide totals. For office, payer, caregiver, or service type slicing, run the Revenue Summary template (or Revenue by Payer Mix) on Reports.
- Stale-looking numbers. Both surfaces are live, not batched overnight. If a number looks low, double-check the Date Range chip on Billing, or the Configuration date range on the report.