The All Alerts table is the full searchable, sortable, filterable list of every alert in your tenant. It lives below the three severity tier cards on the Alerts page and is the place to go when you need to comb through history, group similar alerts, or pull a CSV for a billing review.
Quick answer
Open Alerts. Below the Critical, Important, and Notice tier cards, the All Alerts table lists every alert with five columns. Use the toolbar in the top-right to search, filter, hide columns, change density, or go fullscreen. Click any row to open the Alert Details modal. Use Export CSV at the bottom-right of the table to download the visible rows.
Columns you see in the table
The All Alerts table ships with five columns:
- Name. The alert title, like “Late Clock-In: Sally Ride” or “Open Shift Available”. A small status line below the title shows whether the alert is “Needs Review” or already “Addressed” on a given date.
- Type. The severity chip: Critical, Important, or Notice. These match the three tier cards above the table.
- Description. The alert body text, with the same phrasing the system used to create it.
- Relative Time. Human-friendly age, like “3 days ago” or “5 months ago”.
- Time. The exact timestamp the alert fired, formatted MM/DD/YYYY, hh:mm AM/PM.
1. Open Alerts and find the All Alerts table
Click Alerts in the left sidebar.
The Alerts page opens with three severity tier cards at the top (Critical, Important, Notice), a Recent Alerts panel below them, and the All Alerts table at the bottom of the page.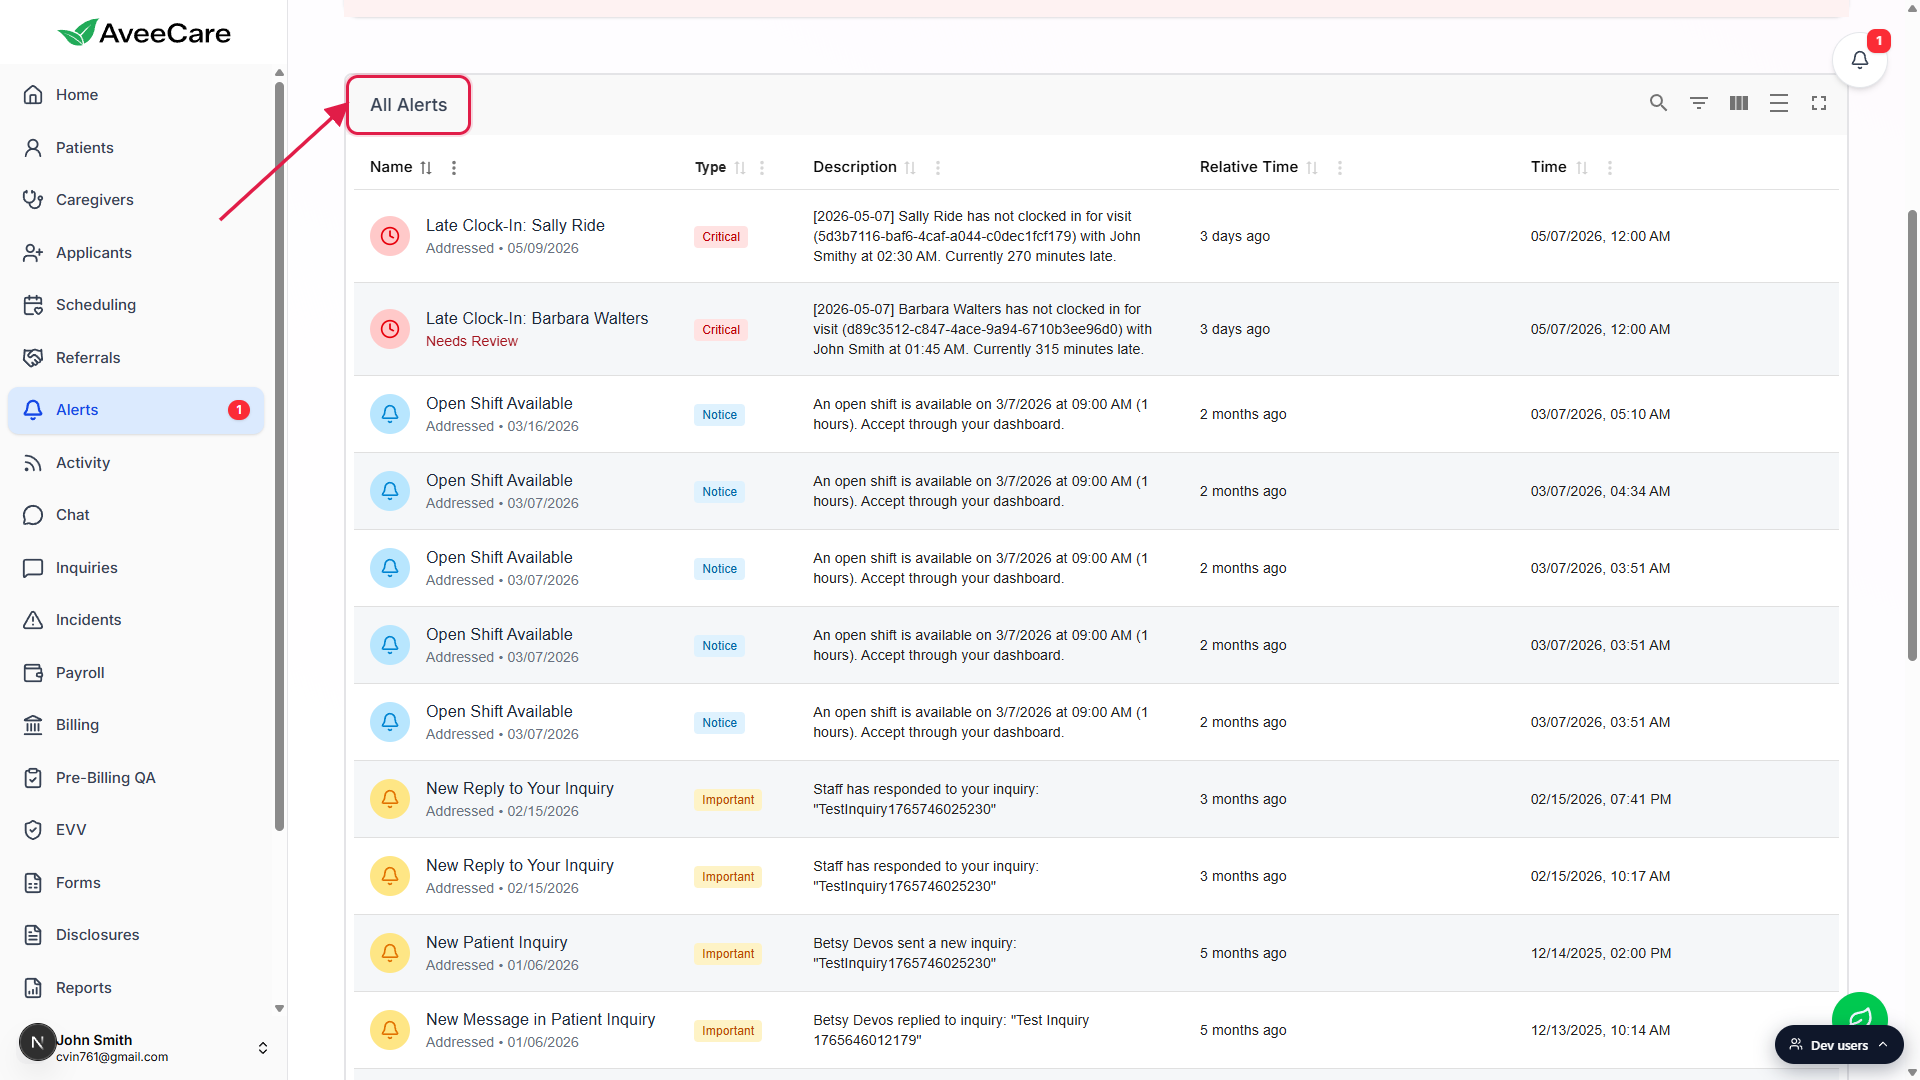
Scroll down to the All Alerts card.
The card is titled All Alerts. It contains the toolbar, the column headers, the rows, and a pagination footer with the Export CSV link.
2. Use the toolbar to search, filter, and adjust columns
Find the five toolbar icons in the top-right of the table card.
Left to right: Show/Hide search, Show/Hide filters, Show/Hide columns, Toggle density, and Toggle full screen. They control the table, not the page. None of them save state, so closing the page resets the toolbar.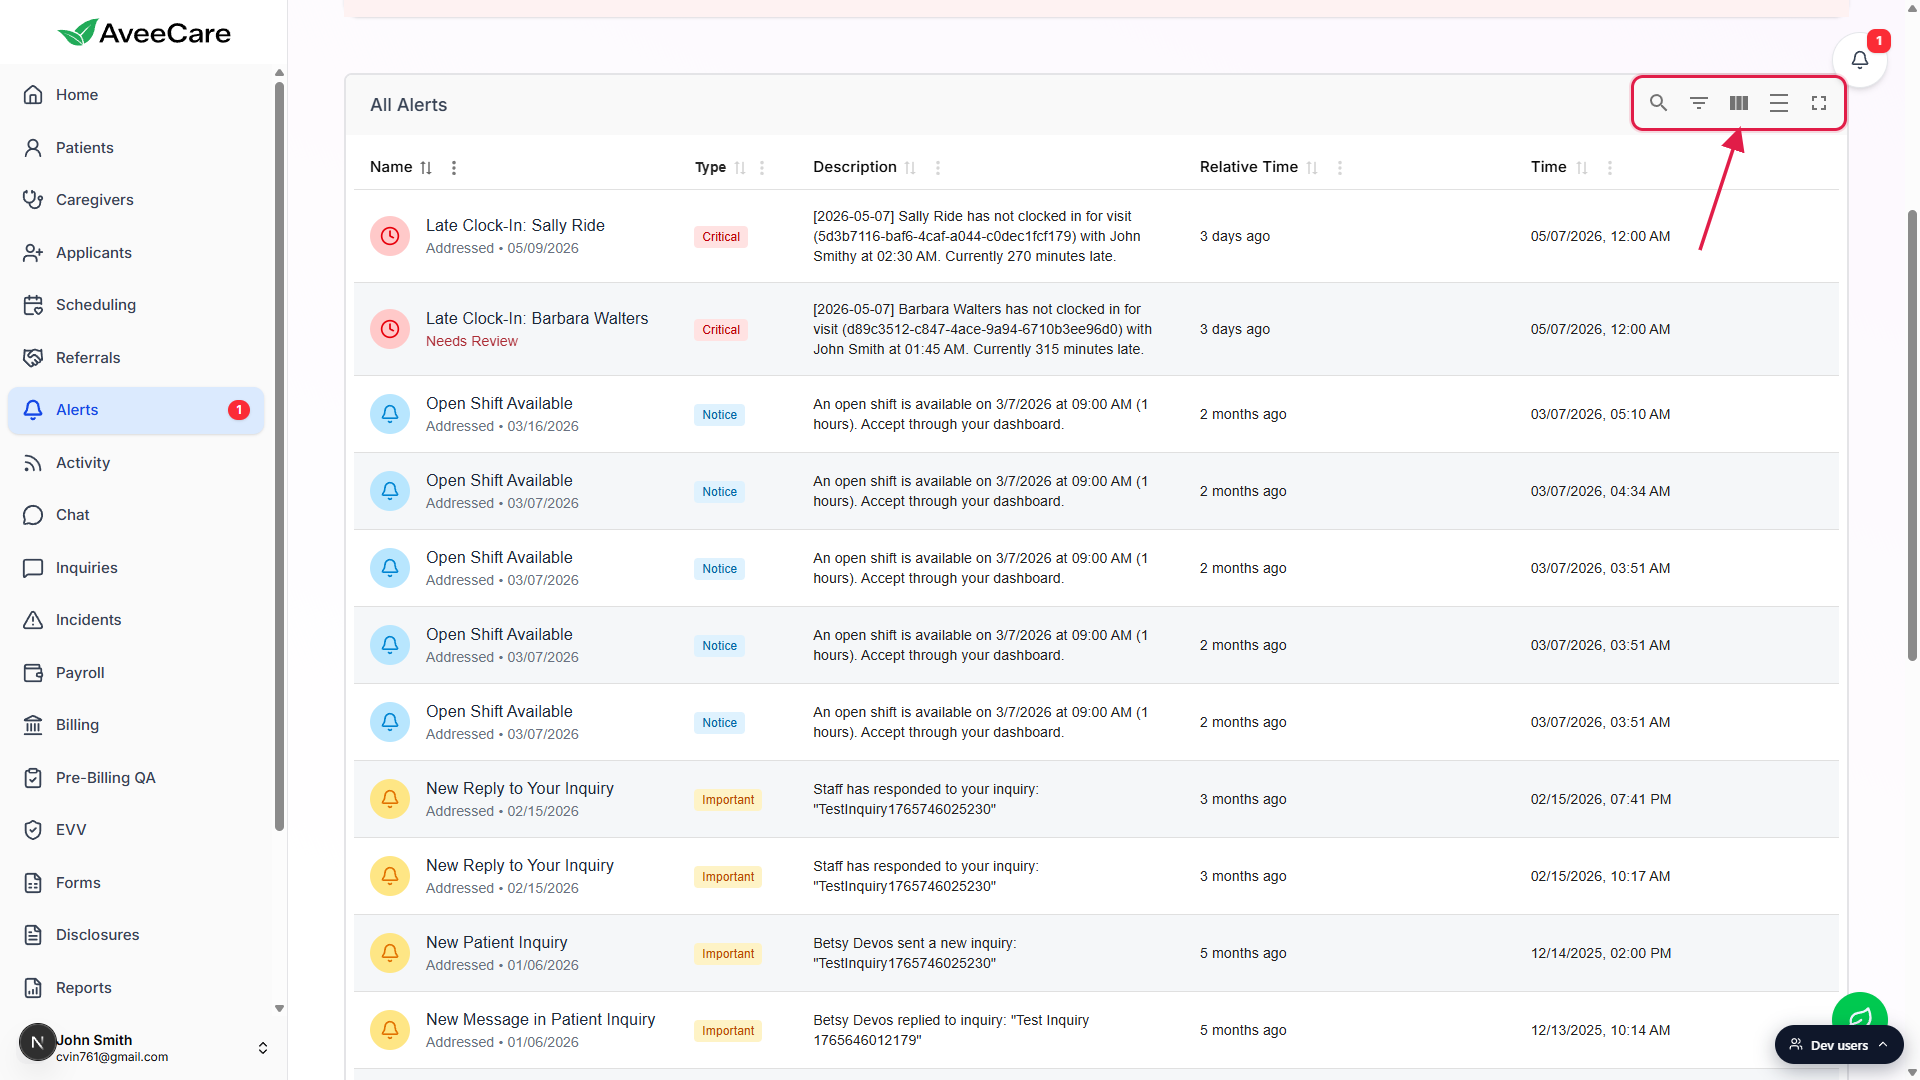
Click Show/Hide search to reveal a single search box that filters across every column.
Type a phrase like Sally Ride or Open Shift and the table narrows to rows whose Name, Description, or Relative Time contain the phrase. Clear the box to see everything again.Click Show/Hide filters to add a per-column filter row under the headers.
The new row drops in five inputs labelled Filter by Name, Filter by Type, Filter by Description, Filter by Relative Time, and Filter by Time. Type into any one of them to narrow that column independently. Combine them to stack filters.Use Show/Hide columns to hide a column you do not need, and Toggle density to compact the rows.
Toggle full screen pops the table out into a maximised view if you want to read long Description text without sidebar chrome in the way.
3. Sort columns and click a row for the detail modal
Click a column header to sort by it.
Click Time for reverse-chronological order (newest first), Type to group all Critical rows together, or Name for alphabetical. A second click flips the sort direction.Click any row to open the Alert Details modal.
The modal shows the full Description, Created By, Time, and Review Status fields, plus a Close button. See the Alert detail and action history article for the full rundown of what the modal contains and how the action surface behaves for shift-swap requests.
4. Page through results and export CSV
Use the pagination footer below the rows.
The footer shows Rows per page (default 20), a count like 1-20 of 51, and first / previous / next / last buttons. Increase rows per page to 50 or 100 if you want fewer pages to step through.Click Export CSV in the bottom-right of the table card.
The CSV downloads the rows that match your current search, filter, and sort. If you want a CSV that only contains Critical alerts from a specific day, search or filter first, then click Export CSV. The file name and contents reflect the live view, not every alert in the system.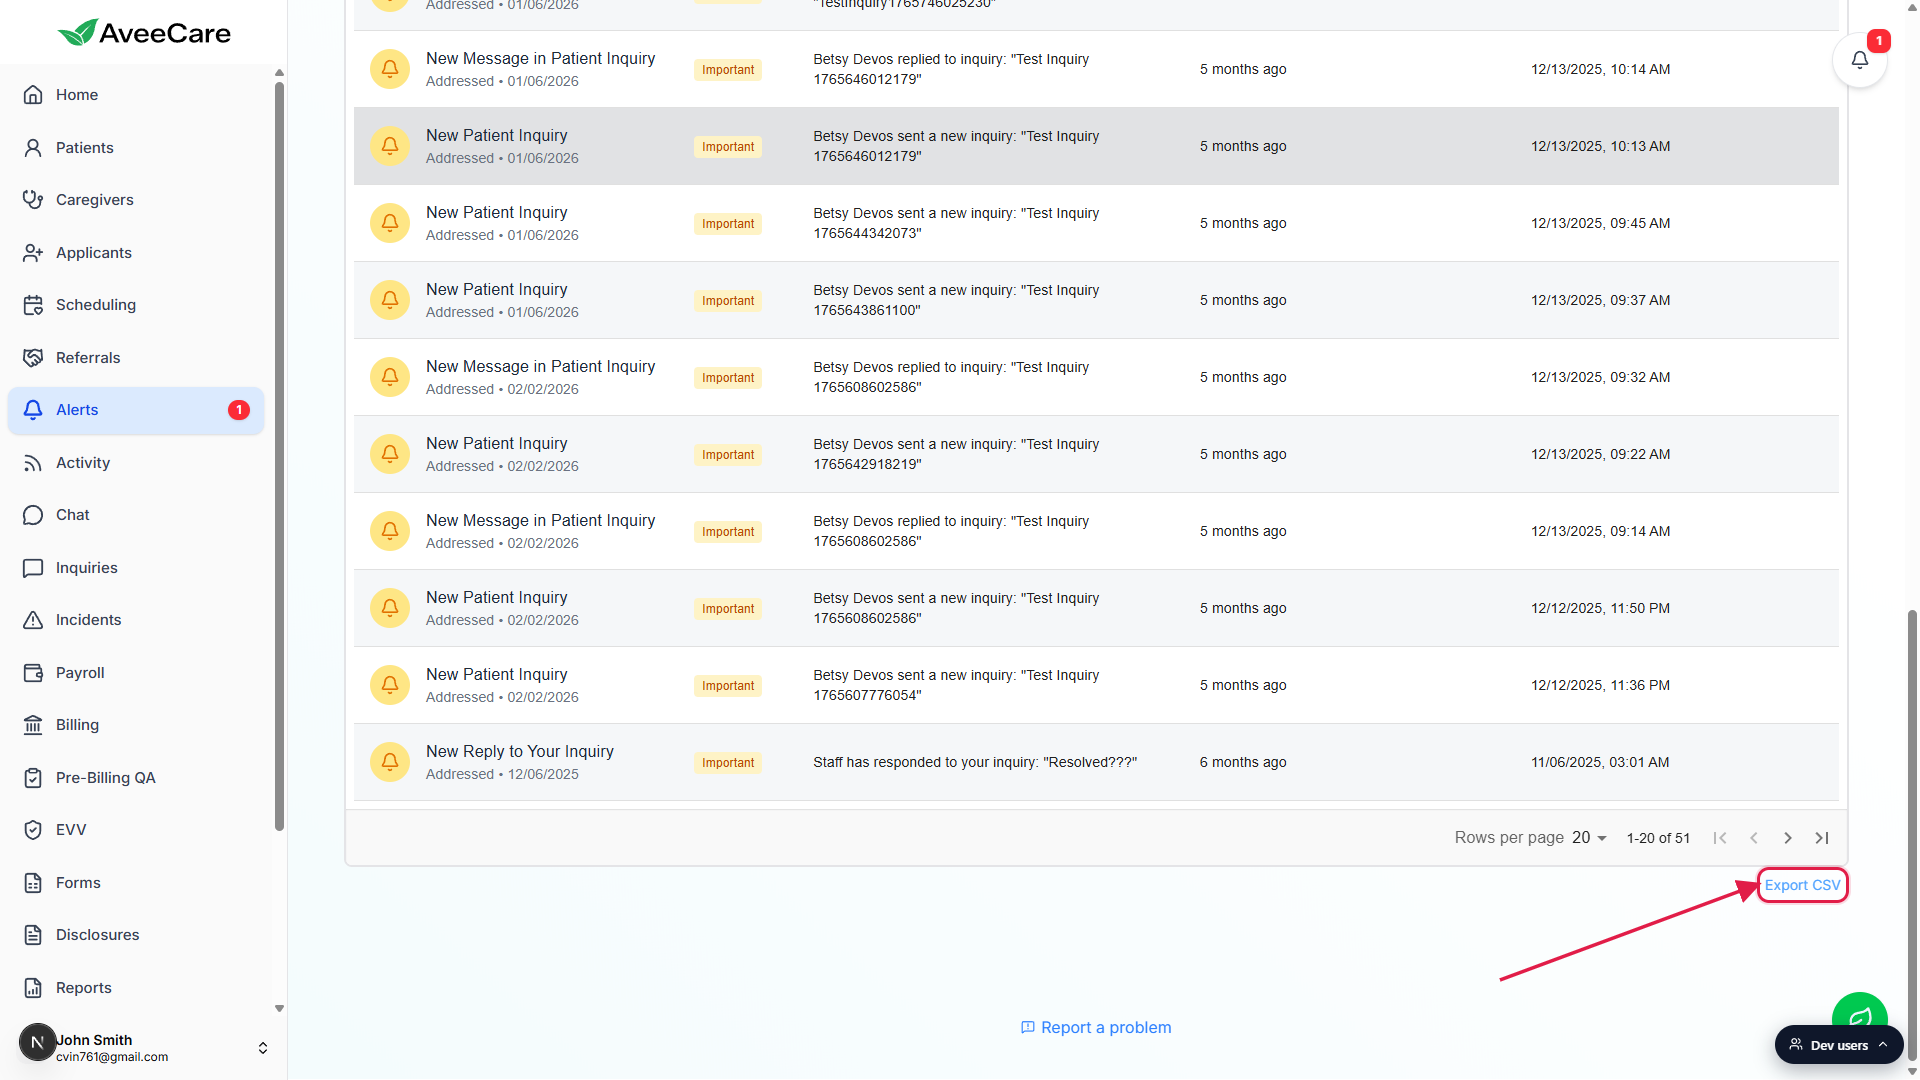
Common pitfalls
- Confusing search with filter. The Show/Hide search icon adds one box that searches every column. The Show/Hide filters icon adds five per-column boxes. They look similar in the toolbar but behave differently. Pick search for a quick keyword sweep, pick filters when you want to narrow on Type plus Name at the same time.
- Forgetting that Export CSV honours the current view. If you have an active search or filter, the CSV only contains rows that match. Clear filters first if you want a full export of every alert.
- Treating Relative Time as sortable for absolute order. Relative Time is a string like 2 months ago, so sorting by it is roughly chronological but not exact. Sort by Time for the precise timestamp order.
- Looking for bulk actions on the table. The All Alerts table has no row checkboxes or bulk-review surface. Mark an alert reviewed by opening it (click the row, or click Review on the Recent Alerts panel) and using the Alert Details modal. There is no shortcut to mark dozens of alerts reviewed at once.
- Toolbar state does not persist. Hidden columns and density choices reset when you leave the Alerts page. If you always want a compact view, toggle density each time.