The Incidents page is the agency-wide ledger of every reported incident. It opens to an Incidents Over Time chart, four stat cards, a filter card, and the Incident Reports table beneath. Office staff use it to spot trends, triage anything still open, and pull the CSV when an auditor or an insurer asks for one.
Quick answer
Click Incidents in the left sidebar. The page header reads Incident Reports with a blue + Create Incident Report button on the top right. The chart sits up top, the four stat cards (Total Incidents, Unresolved, High/Critical, This Month) sit below it, then the Filters card, then the Incident Reports data table.
1. Open Incidents from the sidebar
Click Incidents in the left navigation rail.
The page header reads Incident Reports. The blue + Create Incident Report button sits at the top right and opens the same report modal that caregivers see on the visit detail.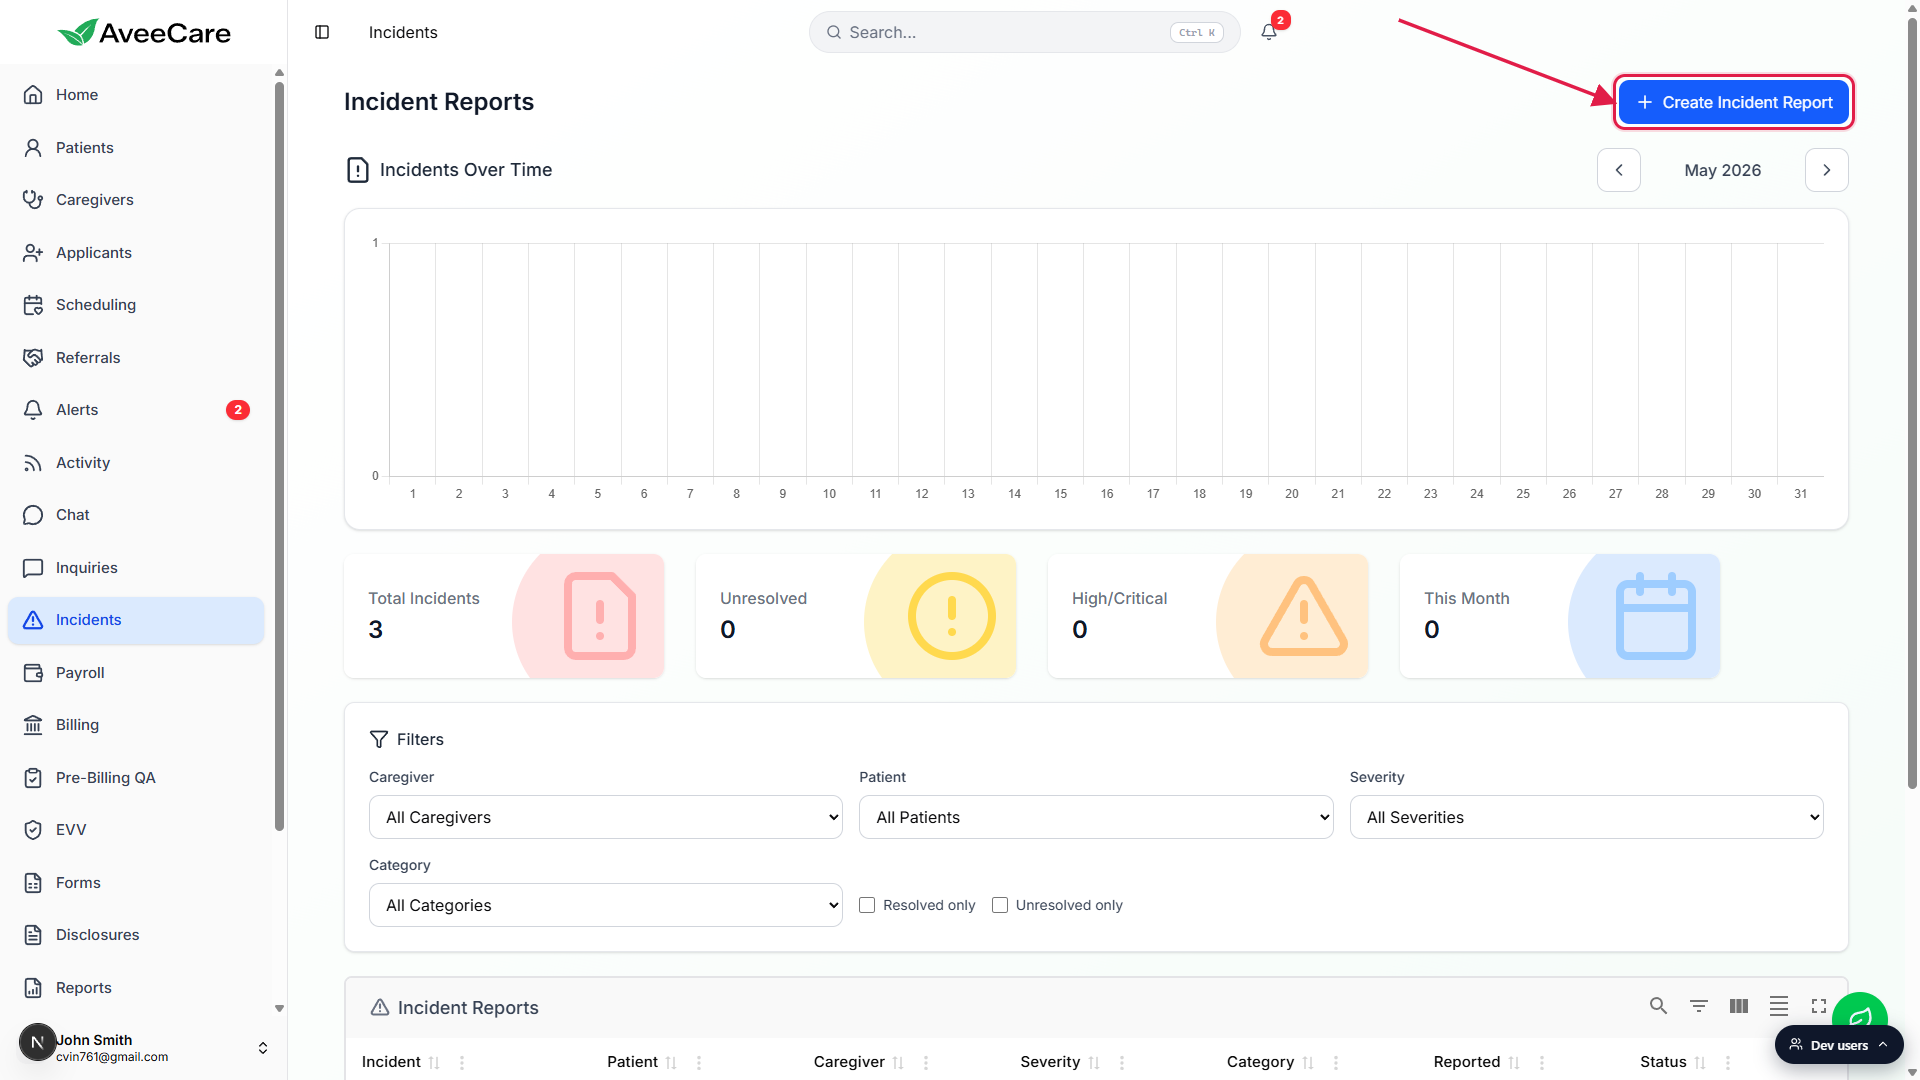
2. Read the chart and stat cards
Step the chart month by month with the arrow controls.
Incidents Over Time is a bar chart, one bar per day of the selected month. The month label sits between the left and right chevrons in the upper right of the chart card. Click the chevrons to walk back or forward one month at a time.Scan the four stat cards beneath the chart.
Total Incidents is the count of every incident visible after filters. Unresolved is how many are still open. High/Critical sums the two top severities so you see the urgent number at a glance. This Month counts incidents in the current calendar month. Cards update live as you change filters.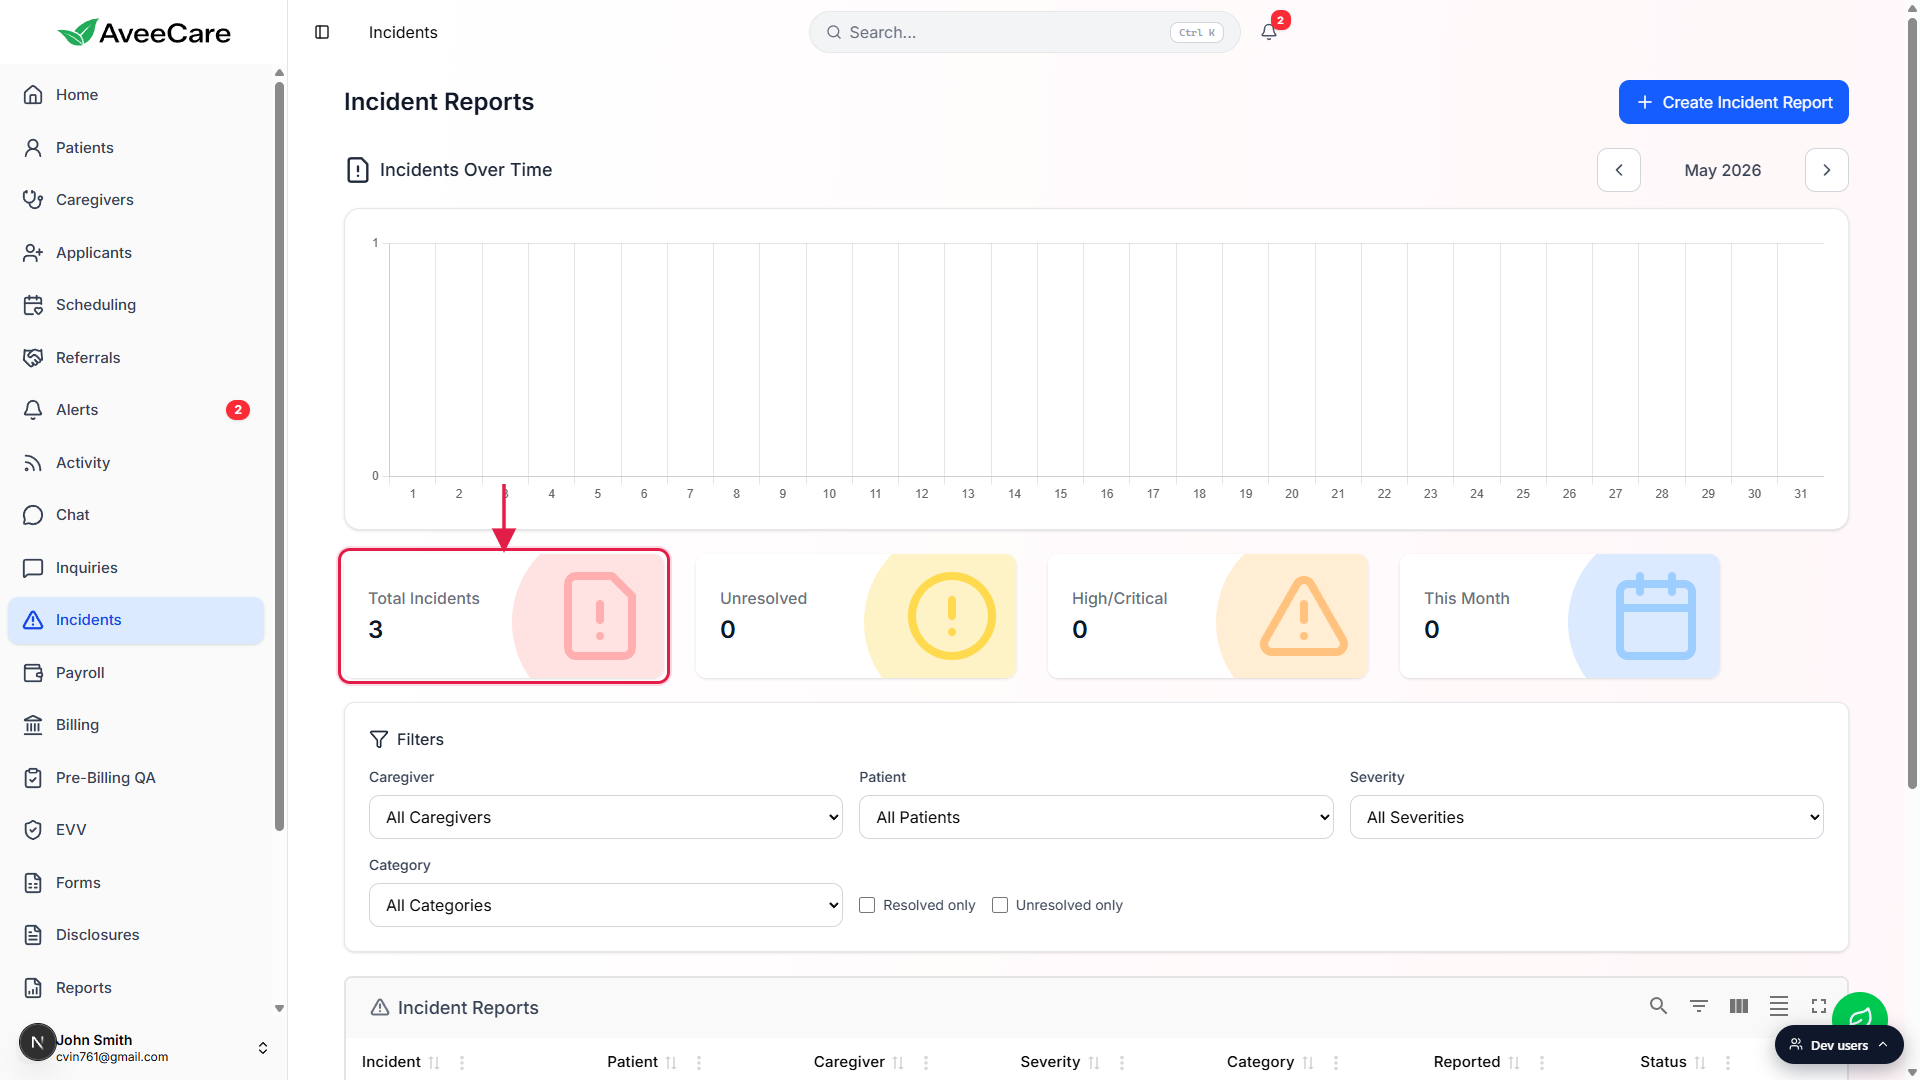
3. Narrow the list with the filter card
Use the Caregiver, Patient, Severity, and Category dropdowns.
Each dropdown defaults to All. Pick a caregiver to see only that person's incidents, a patient to focus on one client, or a severity / category to drill in. Severity options are Low, Medium, High, and Critical. Category options are Fall, Medication, Behavioral, Injury, Equipment, and Other.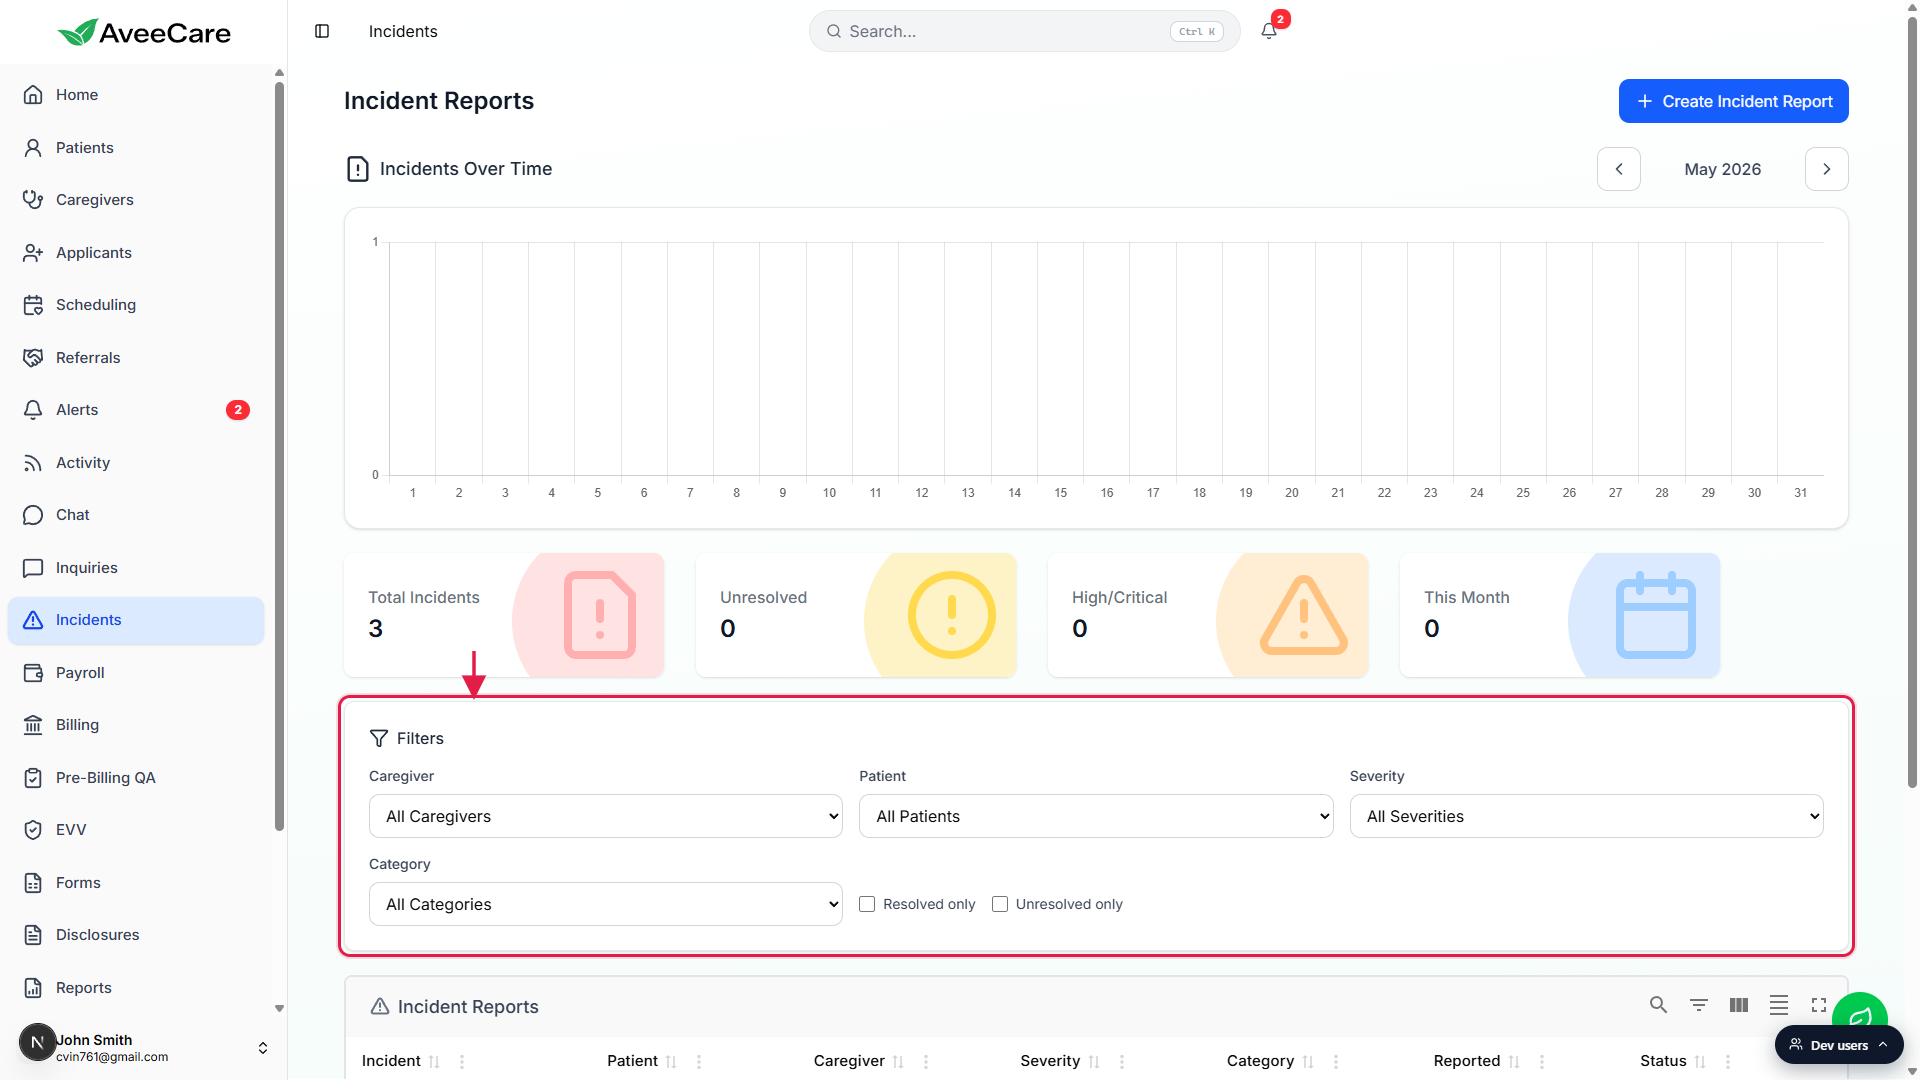
Flip the Resolved only or Unresolved only checkbox to scope the table.
The two checkboxes are mutually exclusive. Checking one unchecks the other. Leave both unchecked to see everything. A blue active pill next to the Filters heading shows how many filters are applied, with a Clear all button next to it when at least one filter is set.
4. Open a row to see the full report
Click any row in the Incident Reports table.
The table shows Incident, Patient, Caregiver, Severity, Category, Reported, and Status. Rows are sorted most-recent first. Clicking a row opens the detail view with every field filed at creation, the resolution section, and Edit / Resolve / Reopen actions.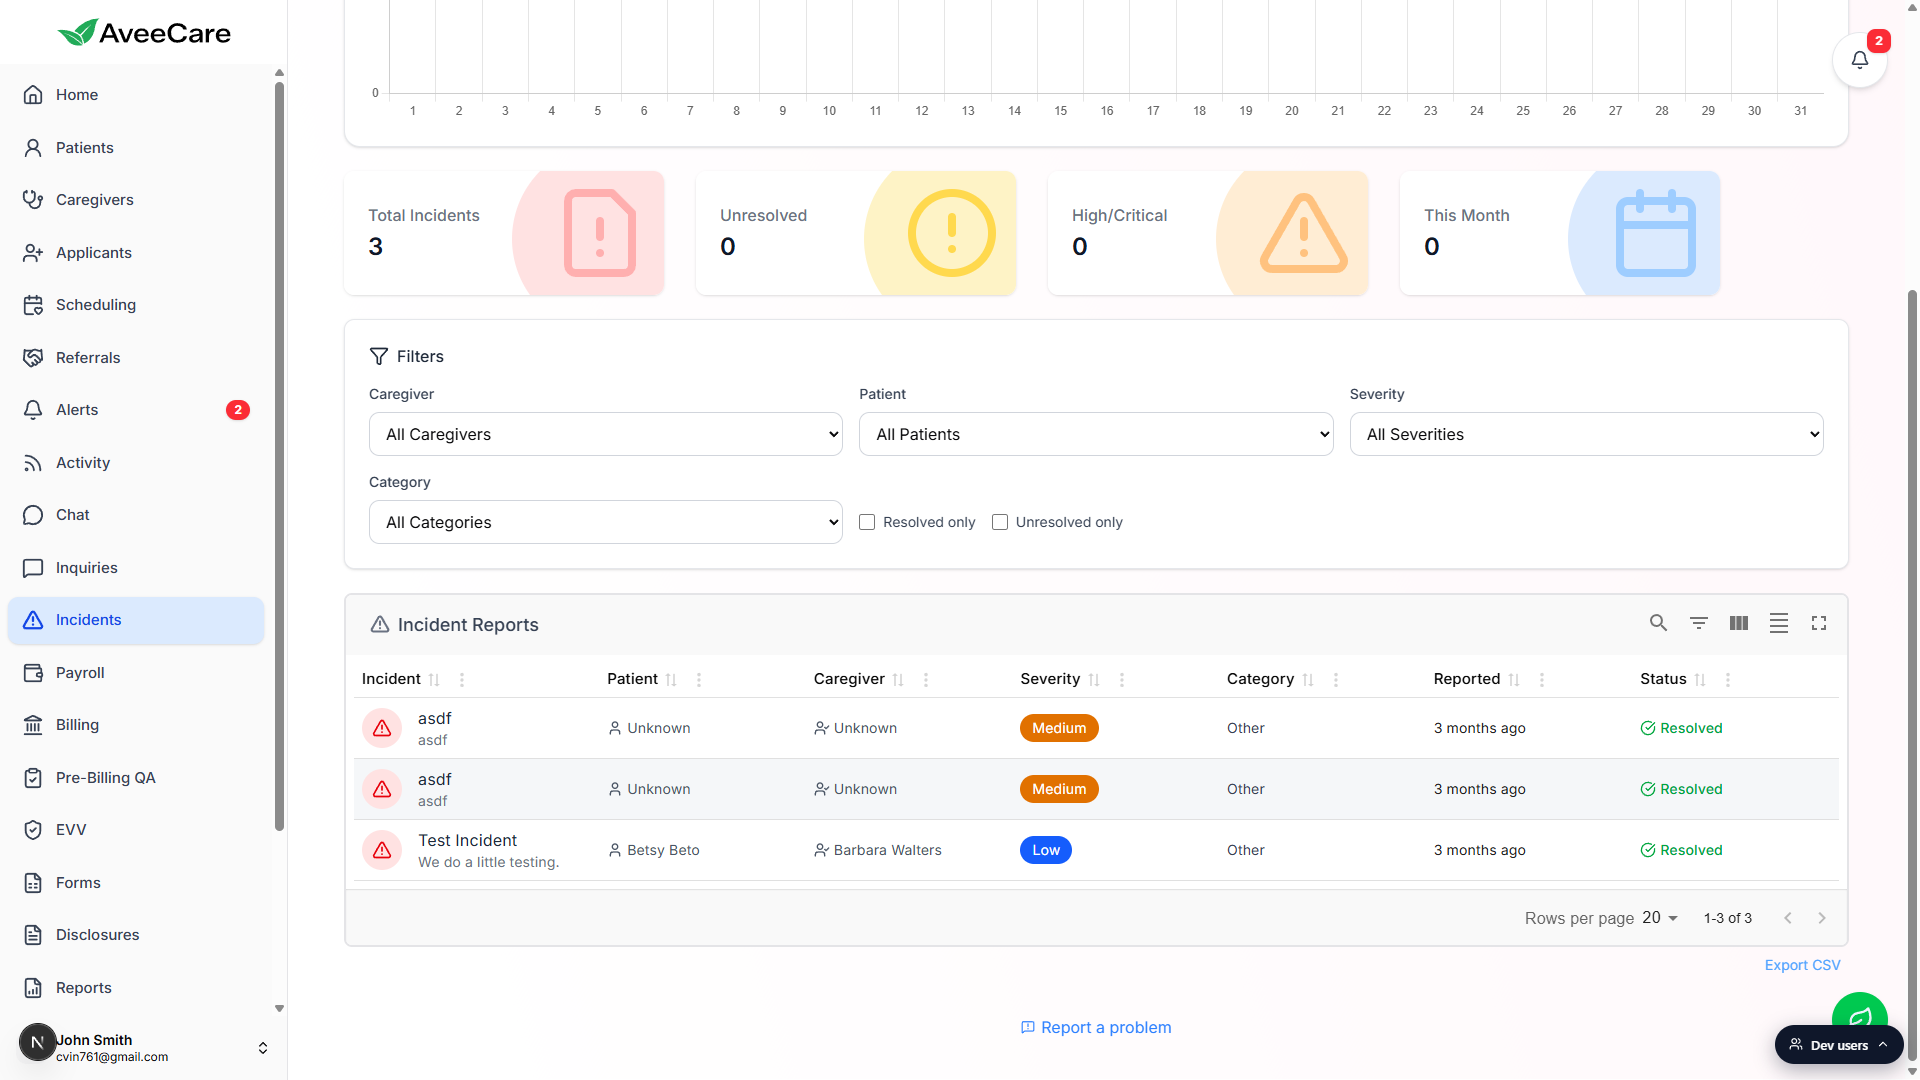
Export the filtered set to CSV.
The Export CSV link sits below the table on the right. Whatever filter combination is active is what the CSV contains, so set the filters first, then export. The file name is incident-reports-YYYY-MM-DD.csv.
Common pitfalls
- Chart bar is empty for the day you reported on. The chart bins by the Reported timestamp, not by the incident date inside the report body. Reports that were filed late show up on the chart on the day they were filed.
- This Month says zero even though Total says three. The three legacy incidents on this seed are from prior months. This Month only counts incidents in the current calendar month, regardless of which month the chart is currently showing.
- Resolved only and Unresolved only are mutually exclusive. You cannot turn both on at once. To clear the toggle, click the same box again or hit Clear all next to the Filters heading.
- High/Critical is a sum, not a single severity. That card adds High plus Critical. To see one severity on its own, set the Severity dropdown.
- The list is office-scoped. If you switch the office context up top, the table, chart, and stat cards re-filter to incidents whose patient or caregiver belongs to the selected office.